The best template is not necessarily the most decorative one. It is the one that matches the purpose of the report, the expectations of the audience, the type of evidence being presented, and the software used by the reporting team. A short internal update may need only a few sections, while a market research report, financial review, project evaluation, or strategic assessment may require a much deeper structure.
Microsoft’s current guidance describes a common professional structure built around a title page, executive summary, introduction, methodology, findings and analysis, conclusions and recommendations, and appendices. University and professional writing guides similarly emphasize clear objectives, evidence, analysis, actionable recommendations, and references where appropriate. :contentReference[oaicite:0]{index=0}
This guide explains how to select, customize, and use a business report template ready to use without allowing the template to dictate the substance of the report. It covers document structure, research, data collection, analysis, visual presentation, Word and Excel workflows, presentation-based reporting, PDF preparation, quality control, common mistakes, and practical examples.
Whether you are preparing a monthly management update, a project review, a market assessment, or a strategic recommendation, the objective is the same: create a document that communicates reliable information clearly enough for another person to understand the situation and make a sound decision.

What Is a Business Report Template Ready to Use?
A business report template ready to use is a pre-structured document designed to help an individual or organization prepare a formal report without designing every section from the beginning. Depending on the template, it may contain a cover page, headings, tables, placeholders for charts, an executive summary area, recommendation sections, and an appendix structure.
The word “ready” should not be interpreted as “finished.” A template supplies the architecture, not the evidence. You still need to define the reporting objective, gather appropriate information, check the accuracy of the data, interpret the findings, and adapt the language for the intended audience.
A strong template also creates consistency. If a company prepares monthly or quarterly reports, using a repeatable structure makes it easier for readers to compare periods. Consistent headings, terminology, KPI locations, chart conventions, and recommendation formats reduce the mental effort required to understand each new report.
Templates can also reduce formatting errors. When heading styles, page structure, tables, and visual hierarchy are already established, the writer can concentrate more attention on the quality of the content. Microsoft specifically recommends saving frequently used documents such as monthly reports or sales forecasts as templates so they can become starting points for future work. :contentReference[oaicite:1]{index=1}
However, a template should remain flexible. A report about customer retention should not look exactly like a construction project status report, even if both documents use the same corporate branding. The core visual identity can remain consistent while the analytical sections change according to the business question.

Why a Good Business Report Template Matters
The primary advantage of a template is structure. Business readers often scan rather than read every sentence, so the document needs visible signposts. Headings, short sections, tables, charts, and concise summaries help a reader locate the information that matters to them.
A well-designed report also separates facts from interpretation. For example, a sales table may show that revenue changed between two reporting periods. The analysis should then explain possible reasons for the change, while the recommendation should describe what management should consider doing next.
This distinction is important because a report becomes less useful when observations, assumptions, opinions, and recommendations are mixed together. A structured template gives each type of information an appropriate place, making the reasoning easier to audit.
Consistency is particularly valuable when reports are prepared by different people. A standardized format gives contributors a common understanding of where information belongs and what level of detail is expected. It also makes management review faster because familiar sections appear in predictable locations.
The template can therefore function as a lightweight reporting system. It establishes the rhythm of the report, encourages evidence-based writing, and creates a reusable framework that can evolve as reporting requirements change.

Core Sections of a Professional Business Report
1. Title Page
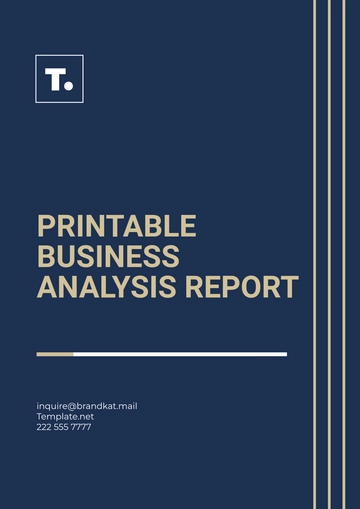
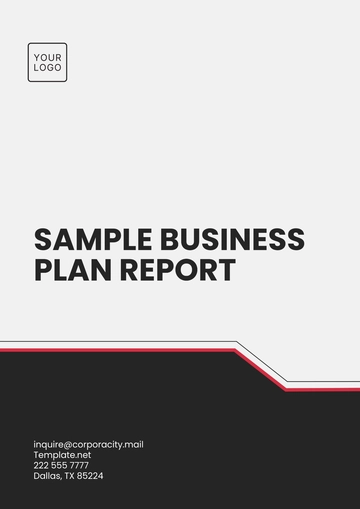
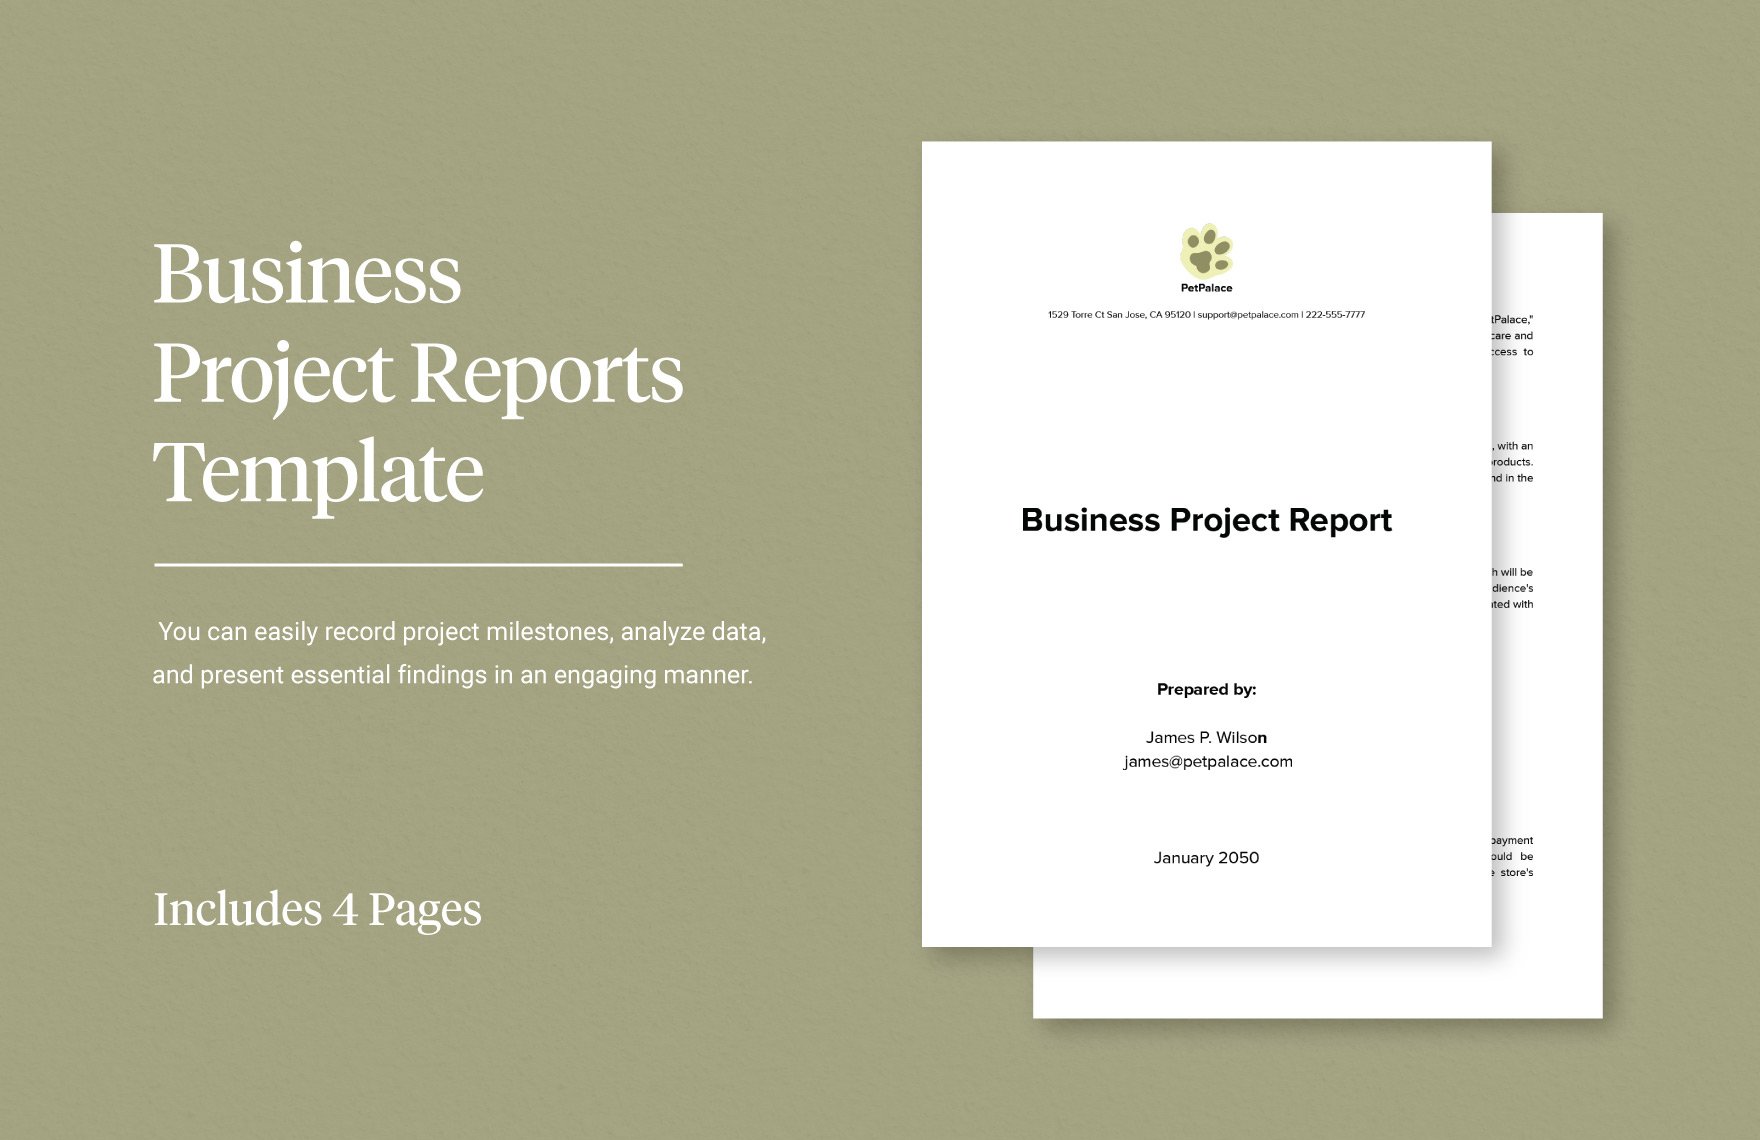
The title page should identify the report clearly. Include the report title, organization or department, reporting period, author or team, and relevant date information. If the report will circulate externally, additional contact or approval information may be appropriate.
A title should describe the subject rather than use a vague label such as “Business Report.” A title such as “Q2 Customer Retention Review” tells the reader immediately what the document covers and which period is being examined.
The title page should remain visually simple. Branding can establish credibility, but excessive graphics, decorative elements, or large blocks of text can make a professional report appear more like marketing material than analytical documentation.
For recurring reports, preserve the same title-page structure while changing the reporting period and subject-specific details. This makes each issue recognizable and helps create a coherent reporting archive.
If the report is being submitted for a formal academic or organizational purpose, check the required cover-page fields before removing anything from the template. A professional template is only a starting point; the final document must satisfy the requirements of its actual audience.

2. Executive Summary
The executive summary gives a decision-maker a condensed view of the entire report. It normally states the purpose, summarizes the approach, highlights the most important findings, and presents the major conclusions or recommendations.
Although it appears near the beginning, it is usually easier to write after the main report has been completed. Only then can the writer identify which findings genuinely matter and which details belong in the body rather than the summary.
An effective summary should stand on its own. A reader who sees only this section should understand why the report was prepared, what was investigated, what the evidence indicates, and what action is being proposed.
Avoid turning the executive summary into a general introduction. An introduction explains what the report will cover, while an executive summary communicates what the completed report actually found and what those findings mean.
For a hypothetical customer-retention report, the executive summary might explain that the report evaluates declining repeat purchases, reviews customer behavior and service records, identifies several operational issues, and recommends changes to follow-up communication and service recovery procedures.

3. Introduction and Background
The introduction defines the business problem, opportunity, or question behind the report. It should explain why the report exists and establish enough context for the reader to understand the later findings.
Background information should be selective. Include facts that help explain the issue, such as the relevant business unit, reporting period, product category, project stage, customer segment, or operational context.
A useful introduction also states the report objective. For example, the objective might be to assess whether a proposed service expansion is commercially viable, identify causes of project delays, or evaluate the effectiveness of a recent marketing initiative.
The scope should be explicit when the subject is broad. State what the report examines and, where useful, what it does not examine. This prevents readers from expecting conclusions about questions that were outside the investigation.
Background should not become a history lesson. Keep the narrative connected to the decision the report is designed to support. Every major piece of context should help the reader understand the problem, evidence, or decision.

4. Methodology
The methodology section explains how information was gathered and analyzed. Its purpose is transparency: readers should be able to understand where the evidence came from and how conclusions were reached.
Possible methods include reviewing internal records, analyzing financial data, surveying customers, conducting interviews, examining competitor information, reviewing project documentation, or comparing actual performance with a budget or previous reporting period.
Do not list methods merely to sound rigorous. Explain why each method was relevant. If a customer survey was used, describe what the survey was intended to measure. If financial records were analyzed, explain the reporting period and the key measures examined.
Data limitations belong here as well. If a dataset contains missing periods, inconsistent definitions, a small sample, or information that cannot be independently verified, disclose that limitation rather than presenting the findings with unjustified certainty.
A concise methodology can increase trust because it allows the reader to distinguish measured evidence from assumptions. It also gives future report writers a repeatable process when the same analysis needs to be performed again.

How to Collect and Organize Business Report Data
Before writing the findings, establish a clear data plan. Start with the business question and determine which measurements can actually help answer it. Collecting large amounts of unrelated information may create the appearance of research without improving the quality of the decision.
Create a simple data inventory containing the source, period, owner, definition, unit, and expected use of each important field. This becomes particularly useful when several spreadsheets or departments contribute information to the same report.
Use consistent definitions. If one department defines a “new customer” as a first-time purchaser and another defines it as a newly created account, combining those figures without reconciliation can produce misleading conclusions.
Record the reporting period carefully. A monthly performance report should distinguish the month being measured from the date on which the report was prepared. Similar distinctions matter for quarterly forecasts, project updates, and financial comparisons.
Finally, preserve the original source data separately from the formatted report. The final report should be a communication layer, not the only place where raw information exists. Maintaining an evidence trail makes corrections and future comparisons much easier.

Data Collection Example
Imagine a hypothetical online retailer preparing a quarterly customer experience report. The team could collect order records, customer-service contacts, refund data, delivery records, and customer survey responses for the same three-month period.
The first step would be to establish consistent definitions. “Refund rate,” for example, should have one agreed calculation and should be measured against a clearly defined transaction population.
The team could then organize the data into categories such as customer behavior, service activity, operational performance, and financial impact. Each category would answer a different part of the business question.
Instead of placing every raw transaction in the final report, the team would summarize the evidence through carefully selected metrics and supporting tables. Detailed transaction-level information could remain in an appendix or separate working file.
This approach keeps the final document readable while retaining enough evidence to explain how the conclusions were formed.

Analyzing Findings Instead of Simply Describing Data
One of the biggest differences between a weak report and a useful report is the quality of analysis. Description tells the reader what happened. Analysis explains what the information may mean, why the result matters, and what questions should be considered next.
Suppose a hypothetical report shows that sales decreased during one quarter. A descriptive sentence might state that revenue declined. A stronger analysis would examine product mix, customer volume, pricing, conversion, seasonality, channel performance, and operational constraints before proposing an explanation.
Good analysis also considers alternative explanations. If customer complaints increased, the report should not automatically conclude that service quality deteriorated. A rise in complaints could also reflect increased customer volume, a change in reporting procedures, or easier access to support.
Use comparisons that are genuinely informative. Depending on the report, this could mean comparing actual results with a budget, the current period with the previous period, one business unit with another, or performance against an established target.
Whenever a conclusion depends on an assumption, identify the assumption. This creates a more honest document and allows decision-makers to challenge the reasoning without confusing an analytical judgment with a verified fact.

Using Variance Analysis
Variance analysis is especially useful for management reports because it compares actual results with a reference point. The reference might be a budget, forecast, prior period, target, or agreed operational standard.
A useful variance section should identify the size or direction of the difference, explain the most credible drivers, and indicate whether the difference requires management attention.
For example, if a hypothetical project spent more than planned, the analysis should distinguish between one-time costs, recurring cost increases, timing differences, and genuine scope expansion.
Do not treat every unfavorable variance as a failure. Some differences may result from deliberate decisions that create value elsewhere. The report should therefore explain the business context rather than label every deviation as positive or negative.
Variance analysis becomes particularly powerful when repeated across reporting periods. Recurring deviations can reveal structural problems that a single-period snapshot might hide.

Using Tables, Charts, and Visual Evidence
Tables are useful when readers need exact values or several related measures at once. A table can show the components of a total, compare departments, list project milestones, or document assumptions.
Charts are useful when the main message involves patterns, relationships, comparisons, or change over time. A line chart can communicate a trend, a bar chart can compare categories, and a carefully designed stacked chart can show composition when the categories remain easy to distinguish.
Do not create a chart merely because the template provides a chart placeholder. Every visual should answer a question. If a simple two-column table communicates the information more accurately than a complicated graphic, use the table.
Give each chart enough context to be understood without a long explanation. Identify the measure, period, unit, and relevant comparison. Avoid unexplained abbreviations and decorative elements that compete with the actual data.
Most importantly, explain the insight after the visual. A chart should not force the reader to perform all the interpretation themselves. A concise sentence can identify the most important movement and connect it to the surrounding analysis.

Choosing Between Word, Excel, PDF, and Presentation Formats
The software format should match the dominant function of the report. Word is generally well suited to narrative-heavy reports where written analysis, structured headings, references, and longer explanations are important.
Excel is particularly useful when the report depends heavily on structured numerical data, formulas, calculations, comparisons, or recurring metrics. It can also support charts and dashboards, although the final presentation should remain readable.
PDF is often best treated as a distribution format rather than the primary editing environment. Once the report is reviewed and approved, a PDF can preserve the intended visual layout for readers who should not need to modify the document.
Presentation formats such as PowerPoint or Google Slides are useful when the report will be delivered verbally to executives, clients, or project teams. A presentation should not simply shrink every paragraph from the full report onto slides. It should highlight the decisions, evidence, and implications that need discussion.
Microsoft currently provides business report templates in Word and describes exporting polished documents as PDF for stakeholders. Its template guidance also emphasizes reusable layouts and consistent branding. :contentReference[oaicite:2]{index=2}

When Word Is the Better Choice
Choose Word when the report needs several paragraphs of explanation around each finding. A market assessment, feasibility review, formal project evaluation, or management analysis often benefits from the flexible narrative structure available in a word-processing document.
Word also makes it easier to manage heading hierarchies, tables of contents, page breaks, headers, footers, and long-form editorial review. A reusable template can preserve these settings so each new report starts with a consistent structure.
For recurring reports, create defined styles rather than manually formatting each heading. A consistent heading hierarchy makes the document easier to scan and makes later editing less risky.
Use tables for information that needs alignment, but avoid forcing long explanations into cells. A table should organize information, not become a substitute for clear prose.
Before exporting the final report, inspect page breaks, chart placement, table widths, headings, and the table of contents. A document can be factually correct and still look unfinished if important headings are stranded at the bottom of pages or tables split awkwardly.

When Excel Is the Better Choice
Excel becomes especially useful when the report is built from structured data that changes regularly. A recurring financial report, sales dashboard, expense analysis, or KPI tracker can benefit from formulas and linked tables.
Separate raw data from calculations and presentation areas. This prevents accidental overwriting and makes it easier to trace a displayed number back to its source.
Use clearly labeled calculation sections and avoid hiding important assumptions inside complex formulas. A report is easier to maintain when another analyst can understand how the outputs were produced.
Charts should be connected to controlled data ranges so they update predictably. Before sharing a workbook, test the charts after changing sample inputs and confirm that labels, totals, and time periods remain correct.
If the final audience does not need to edit the calculations, consider producing a polished PDF or document version from the approved spreadsheet. This separates the analytical working file from the final communication artifact.

How to Write a Business Report Step by Step
Step 1: Define the Decision or Question
Start with the question the report needs to answer. Avoid beginning with a generic instruction such as “write a report about sales.” A stronger starting point is “identify the main reasons sales performance changed during the reporting period and determine which actions deserve management attention.”
The question determines the evidence you need. If the report is evaluating a new product, you may need market information, customer feedback, costs, operational requirements, and expected benefits.
For a project report, the question may instead involve schedule, budget, scope, quality, risks, and outstanding actions. Different questions require different templates and different evidence.
Write the objective in one or two sentences before collecting data. This simple step prevents the research process from expanding into unrelated topics.
Keep the objective visible while drafting. If a paragraph does not help answer the objective or provide necessary context, consider moving it to supporting material or removing it entirely.

Step 2: Identify the Audience
The same evidence can be presented differently depending on who will read the report. Senior executives usually need the decision, evidence, risks, and recommendations quickly. Operational teams may need more detail about processes and implementation.
External stakeholders may require definitions that internal employees already understand. A client-facing report may also require more careful explanation of assumptions and terminology.
Consider the reader’s level of technical knowledge. Avoid unexplained specialist terms when the audience is broad, and provide definitions when technical terminology is unavoidable.
Think about how the report will be consumed. If it will be read on a laptop, dense tables may be acceptable if designed carefully. If it will be printed, page size, contrast, font size, and pagination become more important.
Audience awareness should influence the executive summary as well. The most useful summary is not a generic abstract; it is a concise explanation of what the specific reader needs to know.

Step 3: Build the Evidence Framework
Create a simple evidence framework before writing full paragraphs. List the major questions, the information needed to answer each question, the source of that information, and the intended analysis.
This approach prevents the common mistake of collecting data first and deciding what it means afterward. Instead, each piece of evidence has a defined purpose in the report.
Where possible, identify primary sources and authoritative internal records. Secondary sources can provide useful context, but their limitations should be understood before they become the basis for important conclusions.
Keep source notes during the research process. Waiting until the end to reconstruct where every figure came from creates unnecessary risk and can make verification difficult.
For recurring reports, save the evidence framework as part of the reporting process. The next reporting cycle can then begin with a tested checklist rather than a completely new research plan.
Practical Report Example: A Hypothetical Quarterly Performance Review
Consider a fictional regional service company preparing a quarterly performance review. Management wants to understand whether operational performance improved and which areas require additional investment.
The report objective could be stated as follows: “Evaluate quarterly operational performance against the previous reporting period, identify the main drivers of change, and recommend practical actions for the next quarter.”
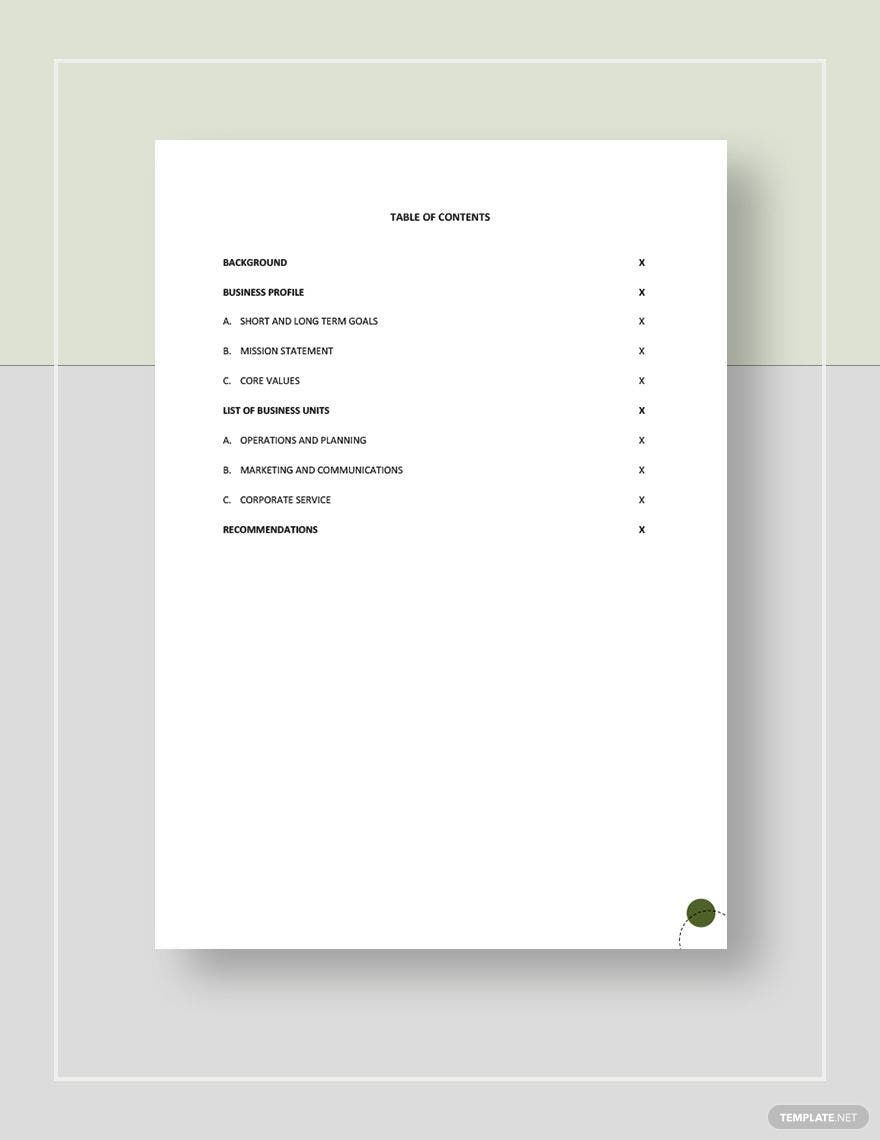
The report could begin with an executive summary followed by business context, methodology, KPI findings, operational analysis, customer observations, financial implications, risks, recommendations, and an appendix containing detailed tables.
The KPI section might include response time, completed jobs, customer complaints, repeat requests, operating cost, and revenue. These metrics should be defined consistently and connected to the report objective.
The analysis could then explain relationships among the metrics. For example, a reduction in response time might be valuable if it coincides with stable quality and manageable operating costs, while a faster process accompanied by increased complaints would require a more cautious interpretation.
Turning Findings Into Recommendations
Recommendations should be directly connected to findings. If the evidence identifies a bottleneck in a specific process, the recommendation should address that bottleneck rather than introduce an unrelated initiative.
Make each recommendation actionable. State what should happen, who should be involved when appropriate, what outcome is expected, and which evidence supports the proposal.
Prioritize recommendations rather than presenting a long list with equal importance. A short list of well-supported actions is usually easier for decision-makers to evaluate than twenty loosely connected suggestions.
Where costs or resource requirements are relevant, acknowledge them. A recommendation that requires additional staff, software, training, or capital should not be presented as though implementation were costless.
It can also be appropriate to recommend further research when the evidence is insufficient for a confident decision. Explain what additional information is needed and how it would improve the decision.
Common Business Report Mistakes
Too Much Information
One of the most common problems is confusing completeness with usefulness. Including every available figure does not automatically make a report comprehensive. Readers need the evidence that helps answer the report question, not every piece of data collected during the research process.
Move supporting details into appendices when they are useful for verification but not necessary for the main argument. This keeps the central narrative focused while preserving transparency.
Another problem is repeating the same information in the executive summary, introduction, findings, conclusion, and recommendations without adding a new purpose. Some repetition is normal because readers scan reports selectively, but each section should perform a different function.
Review every paragraph for its role. Ask whether it provides context, evidence, interpretation, implication, or action. If it performs none of these functions, it may not belong in the report.
Concise writing does not mean removing important nuance. It means giving each idea enough space to be understood without surrounding it with unnecessary explanation.
Weak Evidence
A polished template cannot compensate for unreliable evidence. If the underlying data is incomplete, outdated, inconsistently defined, or poorly sourced, the final report can create false confidence.
Check important figures against their original source. Where a number is calculated, verify the formula and explain the calculation when it materially affects the conclusion.
Be cautious with small samples. A limited set of responses may provide useful qualitative insight without supporting a broad quantitative conclusion. The wording should reflect the strength of the evidence.
Separate facts from assumptions. A report can contain informed judgment, but readers should be able to tell which statements are measured observations and which are interpretations.
Finally, preserve a record of important source material. Good documentation allows another reviewer to understand how the report was constructed and makes future updates more reliable.
Best Practices for a Reusable Reporting System
A reusable template should contain only the structure that genuinely repeats. If every report always has a title page, executive summary, KPI section, recommendations, and appendix, those areas can be built into the template.
Use placeholders that tell the next writer what belongs in each area. Instead of a vague placeholder such as “Insert text,” use a prompt such as “Summarize the purpose, three most important findings, and recommended actions.”
Standardize terminology. If one report uses “revenue,” another uses “sales,” and a third uses “income” for the same measure, readers may assume the terms represent different concepts.
Create a controlled set of recurring metrics. A monthly report becomes more useful when the same core KPIs appear consistently, while additional measures can be introduced when the reporting question requires them.
Review the template periodically. Business priorities change, software changes, and reporting requirements evolve. A template that was effective several years ago may now contain unnecessary sections or outdated metrics.

Practical Solution: A Repeatable Workflow for Using a Business Report Template Ready to Use
The most practical approach is to treat the template as the final stage of a reporting workflow rather than the first stage of research. Begin by defining the business question and audience before opening the document.
Next, establish the reporting period, collect the relevant source information, and create a small evidence register. Record where important figures came from, when the data was collected, and what definitions apply to each major metric.
Then build the findings before writing the executive summary. Use tables and charts selectively, and write a short interpretation next to each major visual so readers understand why the information matters.
After the analysis is complete, write recommendations that connect directly to the evidence. Prioritize actions, acknowledge dependencies, and identify what should happen next. Only then should the executive summary be finalized.
Finally, perform a quality-control pass. Check calculations, dates, names, units, chart labels, headings, page breaks, references, appendix numbering, and consistency of terminology. Export the approved version to the required distribution format only after the content and layout have been reviewed.

A useful internal checklist can contain five questions: Does the report answer its stated objective? Is the evidence credible and clearly defined? Can the reader find the main findings quickly? Do the recommendations follow logically from the evidence? Is the final file suitable for the way the audience will receive and use it?
For recurring reporting, add one final step: record lessons learned after delivery. If readers repeatedly ask for a missing metric, unclear definition, additional comparison, or different visual, update the template or reporting process rather than solving the same problem manually every cycle.
This workflow makes a business report template ready to use genuinely useful because it becomes part of a repeatable operating process. The template saves time, while the evidence framework and review process protect quality.
Reference Examples
The following examples illustrate different document, spreadsheet, presentation, research, and analysis formats that can serve as visual references when selecting or adapting a reporting structure.
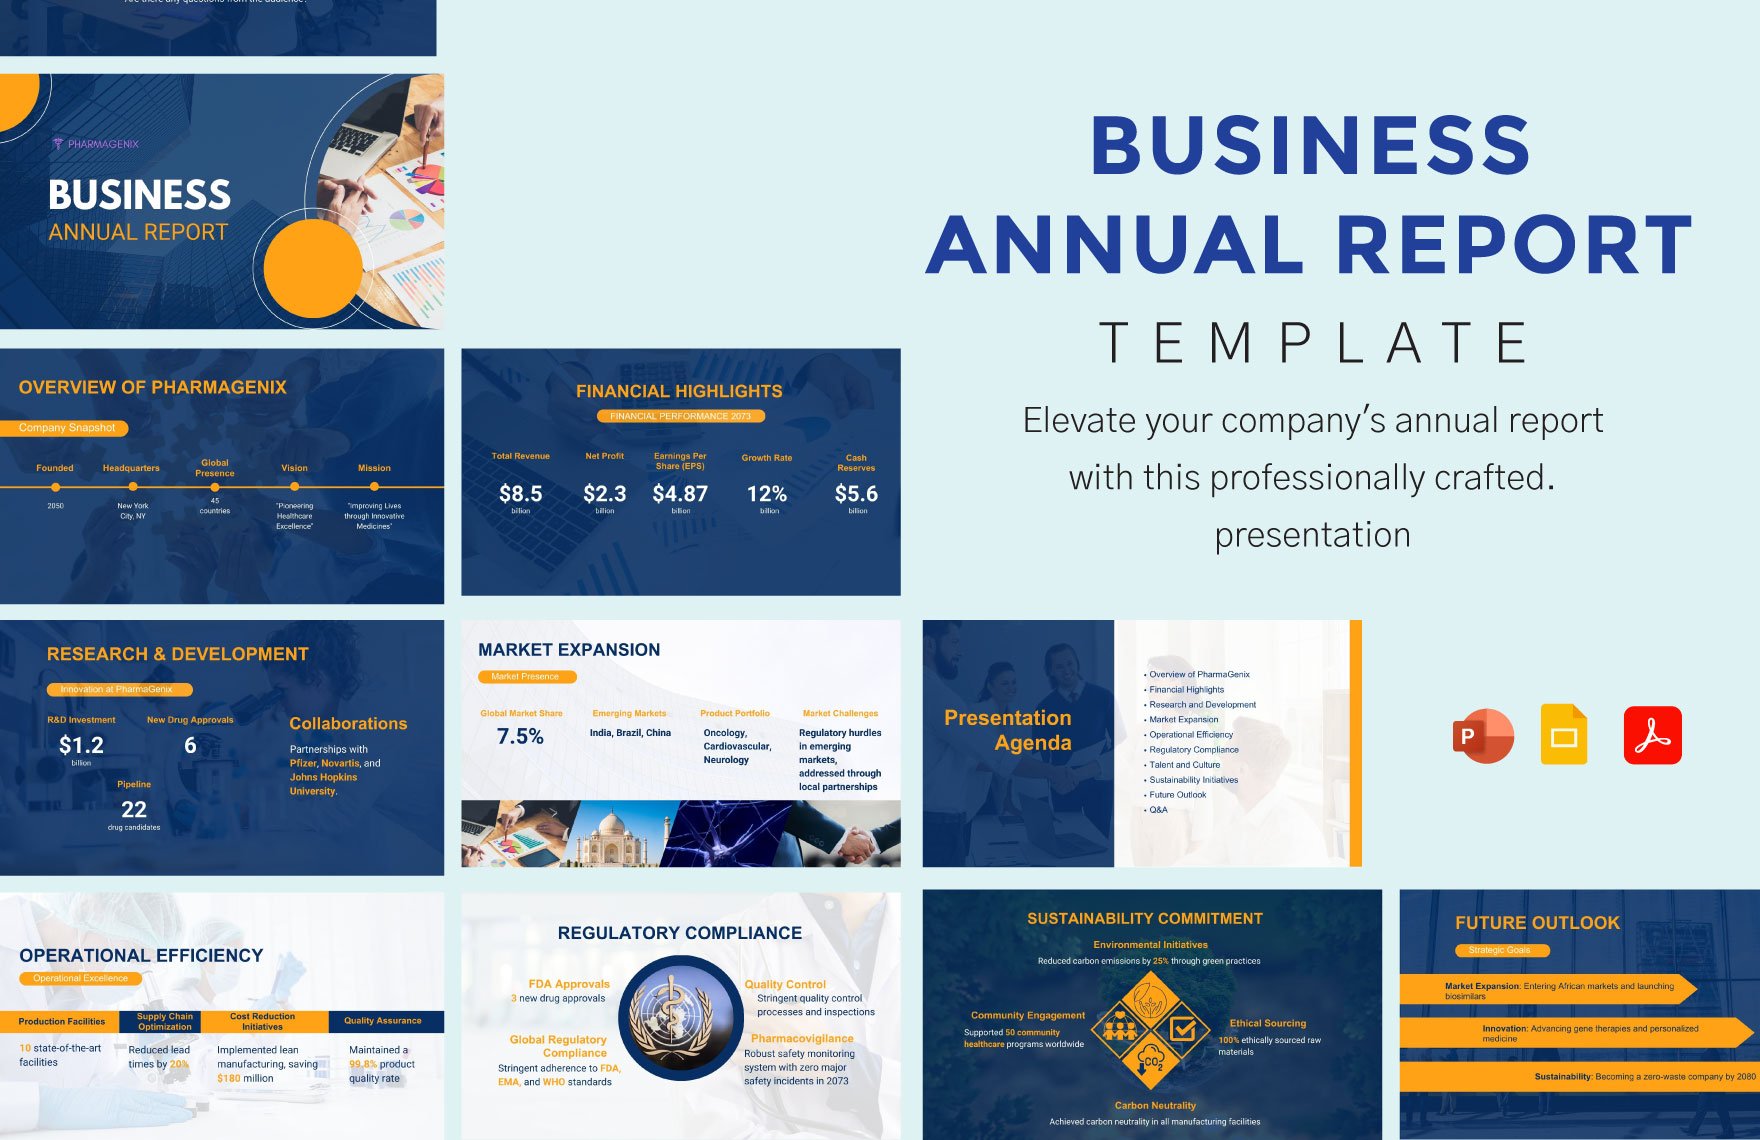
business report template ready to use free
Source: Template.net
business report template ready to use pdf

Source: Template.net
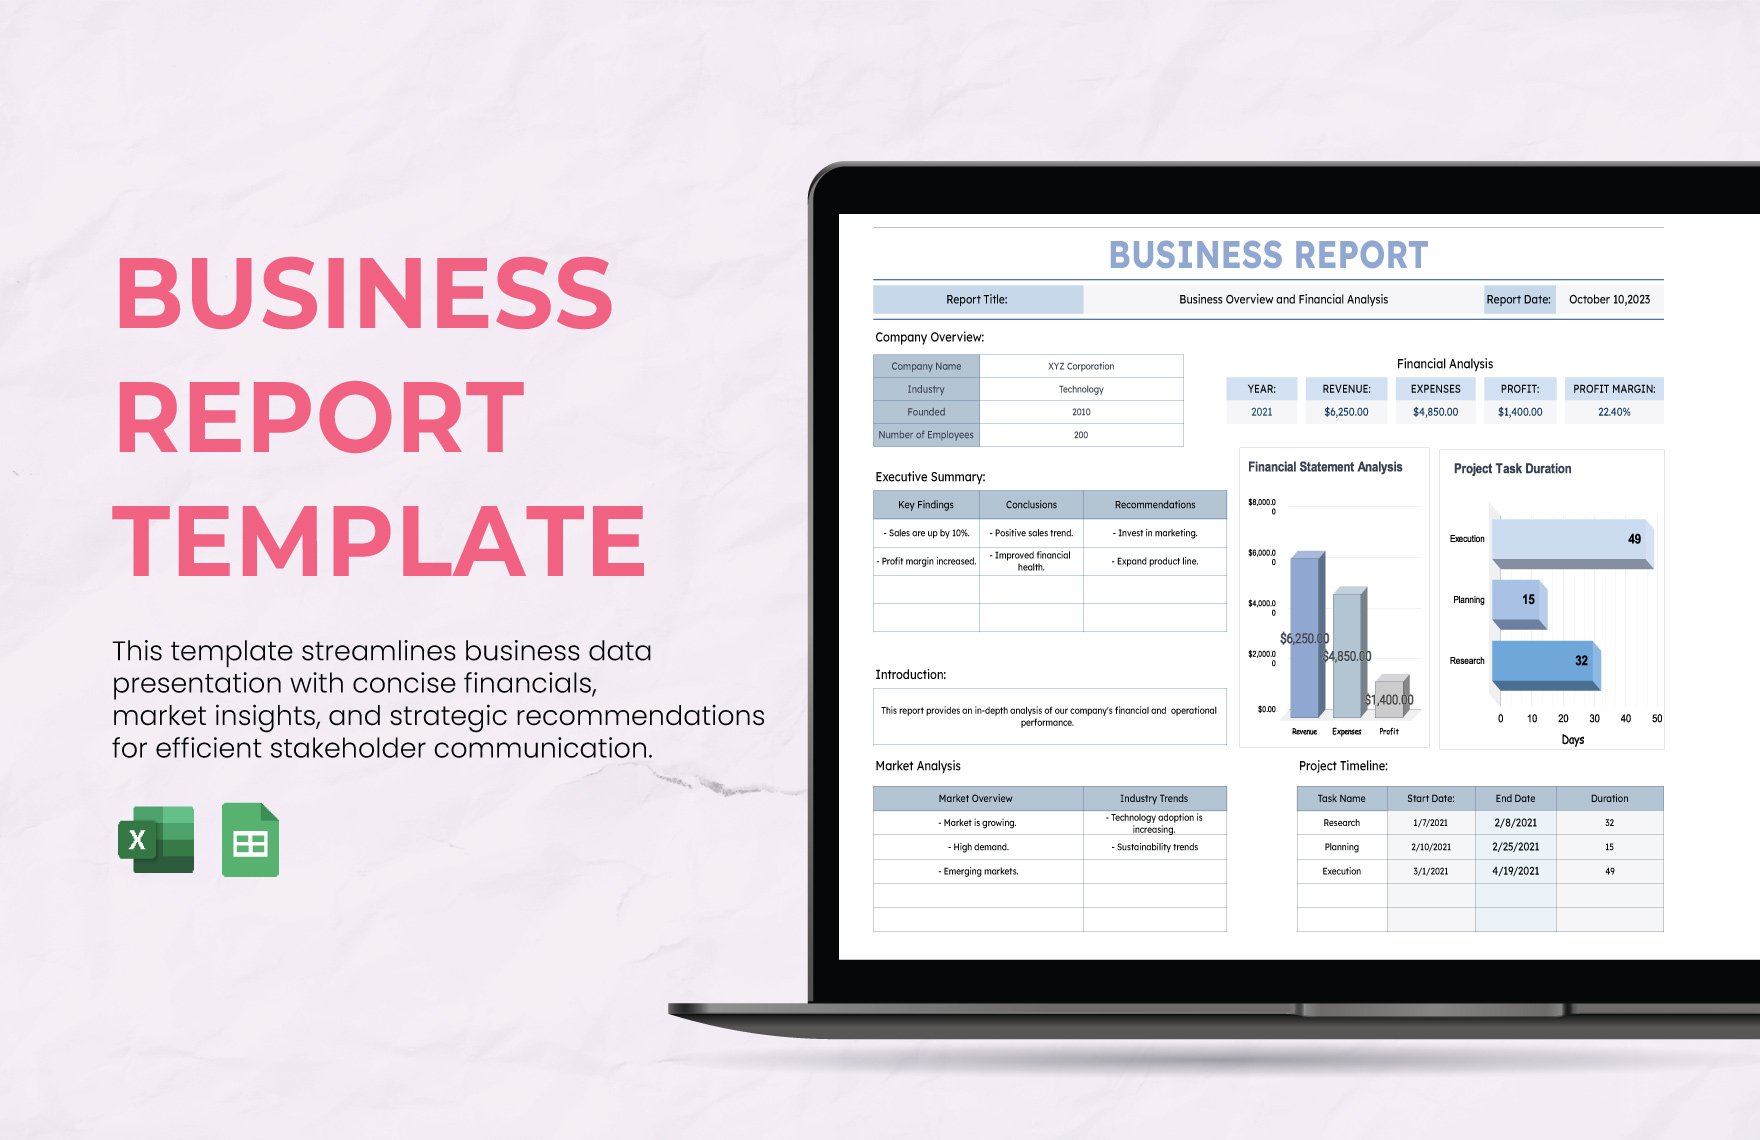
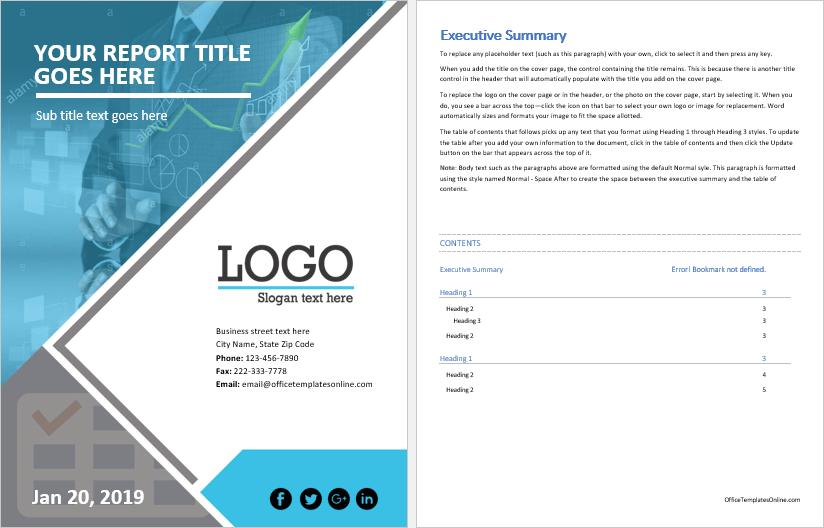
business report template ready to use in word
Source: Office Templates Online
business report template ready to use template
Source: Template.net
business report template ready to use free download
Source: Template.net
business report template ready to use in excel
Source: Template.net
business report template ready to use google slides

Source: Slide Members
business report template pdf

Source: Template.net
Frequently Asked Questions
What should a business report template include?
A general professional structure can include a title page, executive summary, introduction, background, methodology, findings, analysis, conclusions, recommendations, references, and appendices. Not every report needs every section. The final structure should reflect the purpose, audience, evidence, and reporting requirements.
Is a template better than starting from a blank document?
For recurring or structured reporting, a template usually saves time and improves consistency. It is particularly useful when multiple people prepare similar reports. A blank document may be appropriate when the report has unusual requirements or when the organization is still developing its reporting structure.
Should the executive summary be written first?
It appears near the beginning, but it is generally easier to write after the main report is complete. Writing it last allows the author to summarize the actual findings and recommendations rather than predicting what the report will eventually say.
What is the difference between findings and analysis?
Findings describe the evidence or results produced by the investigation. Analysis interprets those results and explains their significance. Keeping the two concepts distinct helps readers understand which statements are observations and which are conclusions drawn from those observations.
Should charts be included in every business report?
No. Charts should be used when they make patterns, comparisons, or relationships easier to understand. If a small table communicates exact values more clearly, a table may be the better choice.
When should a report use Excel?
Excel is especially useful when calculations, structured datasets, recurring KPIs, financial analysis, or data-driven charts are central to the report. It can function as both an analytical workspace and a reporting format, although complex analysis may be easier to communicate through a separate Word or PDF document.
When should a report be exported to PDF?
PDF is useful when the document has been finalized and needs to preserve its intended layout for distribution. Before exporting, review page breaks, charts, tables, fonts, hyperlinks if applicable, and the appearance of headers and footers.
Can the same template be used for different report types?
Yes, if the template is modular. Keep recurring elements such as branding, title-page structure, heading styles, and page design consistent, while changing sections such as KPIs, methodology, analysis, risk assessment, or recommendations according to the reporting purpose.
How can a template make recurring reports faster?
Build repeated elements into the template, including headings, table styles, page structure, recurring KPI fields, instructions for writers, and standard terminology. Then keep source data and calculations organized separately so the report can be refreshed without rebuilding the document every reporting cycle.
What makes recommendations in a business report useful?
Useful recommendations are specific, evidence-based, feasible, and connected to the report’s findings. They should explain what action is proposed and, when relevant, indicate priorities, expected benefits, resource implications, timing, or dependencies.
Conclusion
A business report template ready to use is most valuable when it provides structure without replacing professional judgment. The template should make the document easier to navigate, establish consistent formatting, and reduce repetitive design work, while the writer remains responsible for evidence, analysis, accuracy, and recommendations.
The strongest reports begin with a clearly defined business question and audience. From there, the writer can collect relevant information, establish consistent definitions, analyze meaningful comparisons, select useful tables and charts, and explain what the evidence means.
For recurring reporting, the process becomes even more powerful when the template is connected to a repeatable workflow. A stable structure, evidence register, data definitions, quality-control checklist, and review process can turn individual reports into a consistent management information system.
Whether the final document is prepared in Word, Excel, PDF, or a presentation format, the same principle applies: clarity should serve the decision. A visually attractive template is useful, but a well-organized report that makes reliable information easy to understand is far more valuable.
The best business report template ready to use is therefore the one that fits the reporting purpose, supports the evidence, communicates efficiently with its intended audience, and can be improved over time. Start with structure, build from verified information, analyze rather than merely describe, connect recommendations to evidence, and review the final document carefully before it reaches its readers.
A dependable reporting system does not require every report to look identical; it requires every report to be clear, traceable, purposeful, and useful. By adapting a well-structured template to the question at hand, organizations can spend less time rebuilding documents and more time producing reporting that supports better decisions.
