A business sales forecast Template is a structured way to estimate future sales by period, product, service, customer segment, sales channel, or opportunity. The best templates do more than provide empty cells: they make assumptions visible, separate units from price, show how revenue is calculated, and create a repeatable process for comparing forecasts with actual results. For a small company, the right spreadsheet can turn scattered sales expectations into a practical planning model. For a growing company, it can provide a common framework for sales, finance, operations, and leadership.
Sales forecasting is not the same as guessing an annual revenue number. The U.S. Small Business Administration recommends making financial projections specific enough to support planning, with greater detail for the first year. Its guidance also connects sales targets with break-even analysis, while its sales-forecasting guidance recommends choosing a manageable level of detail rather than reducing the forecast to one unexplained dollar figure. A useful model therefore shows where the forecast comes from and which assumptions can change it.
This article explains how to structure a forecast, which fields matter, how to choose between historical and pipeline-based methods, how to use spreadsheet formats, how to connect the forecast with a business plan, and how to review forecast accuracy. The goal is not to create a complicated financial model for its own sake. The goal is to build a working forecast that can answer practical questions such as what is likely to sell, when revenue should arrive, which products are driving the result, and what assumptions deserve another review.
What a business sales forecast should actually show
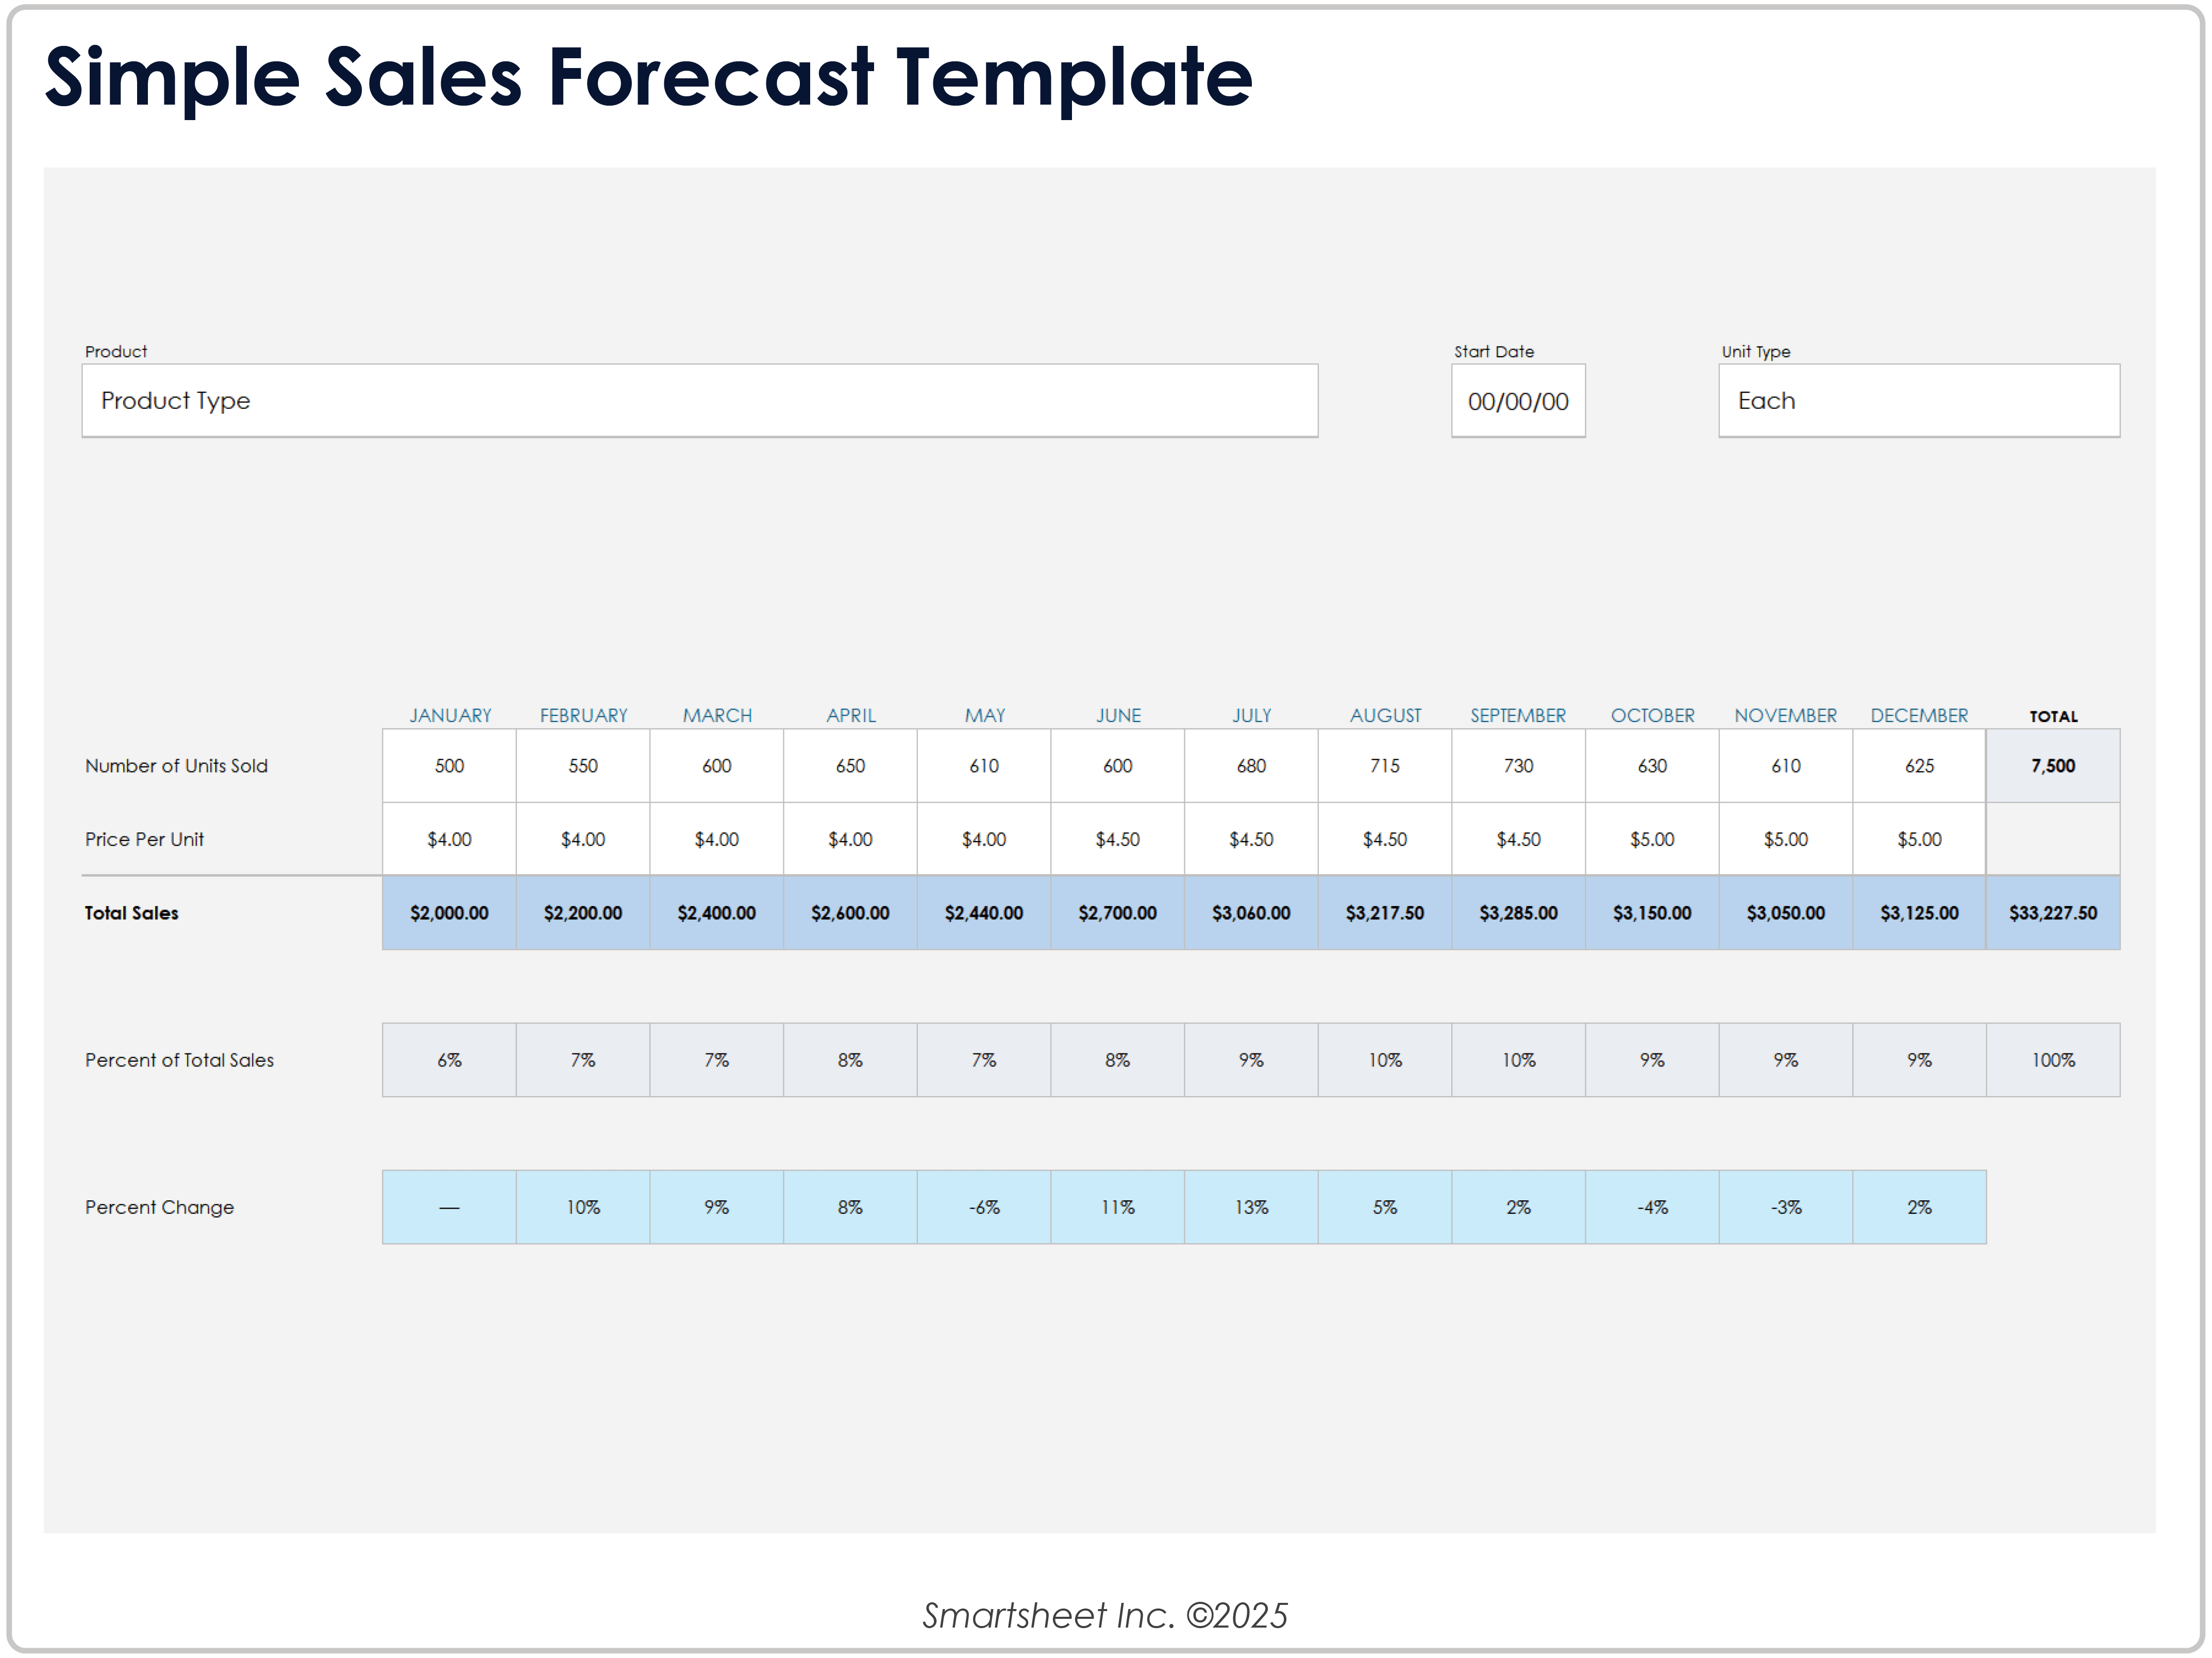
A sales forecast estimates expected sales for a defined period. At its simplest, revenue can be modeled as units sold multiplied by selling price. That relationship is valuable because it makes a forecast explainable. If projected revenue rises, the model should reveal whether the change comes from selling more units, increasing prices, changing the product mix, adding customers, or another explicit assumption. A forecast that hides these drivers is much harder to challenge or improve.
The period can be daily, weekly, monthly, quarterly, or annual. Monthly forecasting is often a useful balance for operating plans because it exposes seasonality without creating an excessive number of rows. Quarterly views are useful for management reporting and longer planning horizons. A business with highly variable daily demand may need a daily layer underneath a monthly summary, while a business with long enterprise sales cycles may focus more heavily on opportunity close dates and sales stages.
The level of detail should match the decision the forecast is intended to support. The SBA has specifically advised businesses not to forecast sales as only one large dollar figure or as an impractically detailed list of every transaction. A manageable grouping by product, service, channel, or another meaningful category makes it easier to explain changes. For many businesses, a practical starting point is product or service, units, price, revenue, and forecast period, with additional fields added only when they support a decision.
Core components of a useful sales forecast
The first component is the forecast period. Label every column with a specific month, quarter, or year and make the fiscal-year convention clear. The second is the sales unit: a product quantity, subscription, service engagement, contract, customer, or another measurable unit. The third is price or average selling price. These inputs should be separated whenever possible so that management can distinguish volume changes from pricing changes.
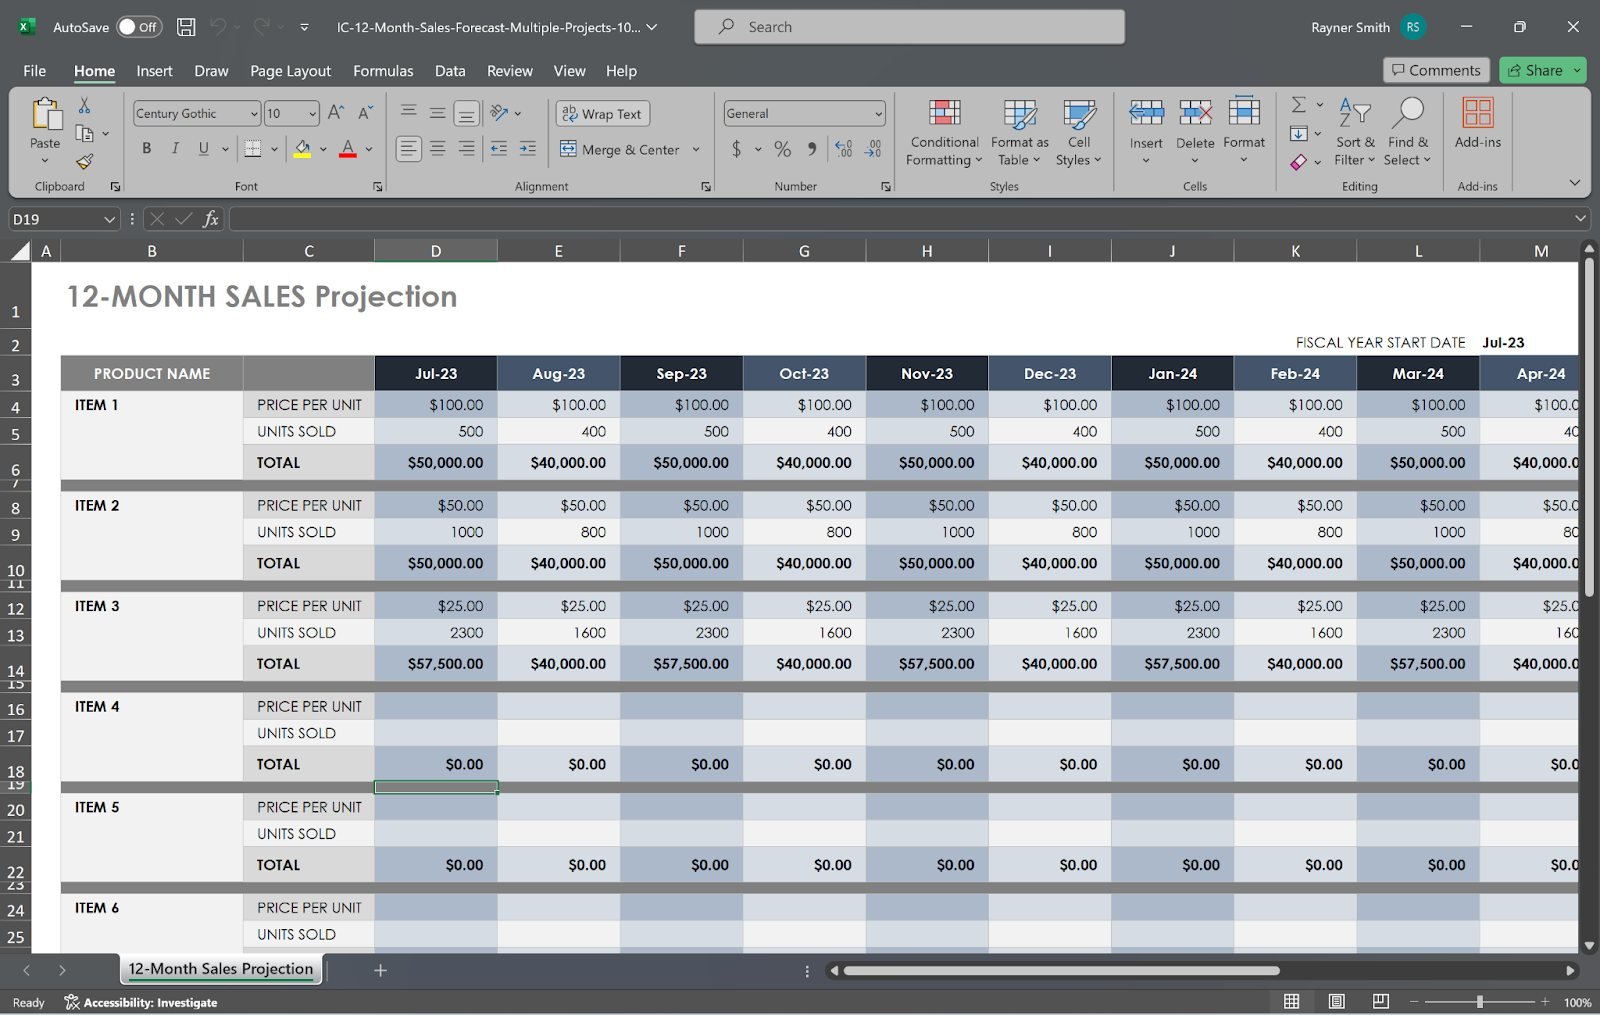
The next component is revenue. A basic product model can use a formula equivalent to units sold × price per unit = revenue. More advanced models may include discounts, returns, recurring revenue, contract timing, product bundles, or multiple revenue streams. Cost information can also be useful, particularly when the forecast is being used for profitability planning. A model that includes unit cost, contribution margin, or gross profit can show whether higher sales volume is actually improving the economics of the business.
A strong template also includes assumptions. Examples include expected growth, seasonality, pricing changes, conversion rates, customer retention, sales-cycle length, promotional effects, capacity limits, and expected changes in the product mix. Assumptions should be visible rather than buried inside formulas. This makes scenario planning much easier because management can change a small number of drivers instead of manually editing dozens of forecast cells.
How to choose the right forecasting method
Historical forecasting starts with what the business has already experienced. If sales have been relatively stable, historical monthly or quarterly patterns can provide a useful baseline. Seasonality can then be incorporated by examining how sales typically vary by period. This method is particularly useful for established businesses with consistent transaction volume, although it becomes less reliable when the market, pricing model, product range, or customer behavior has changed substantially.
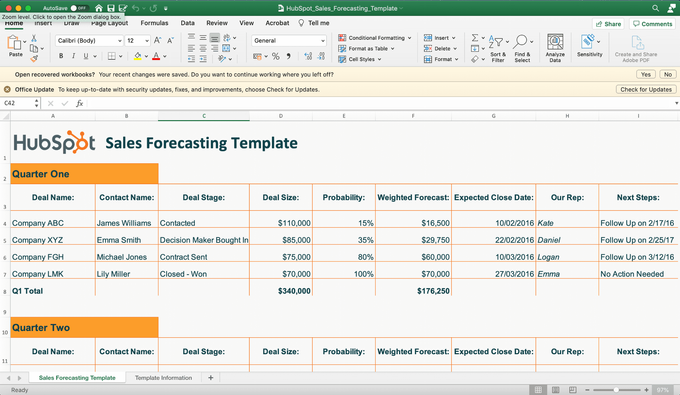
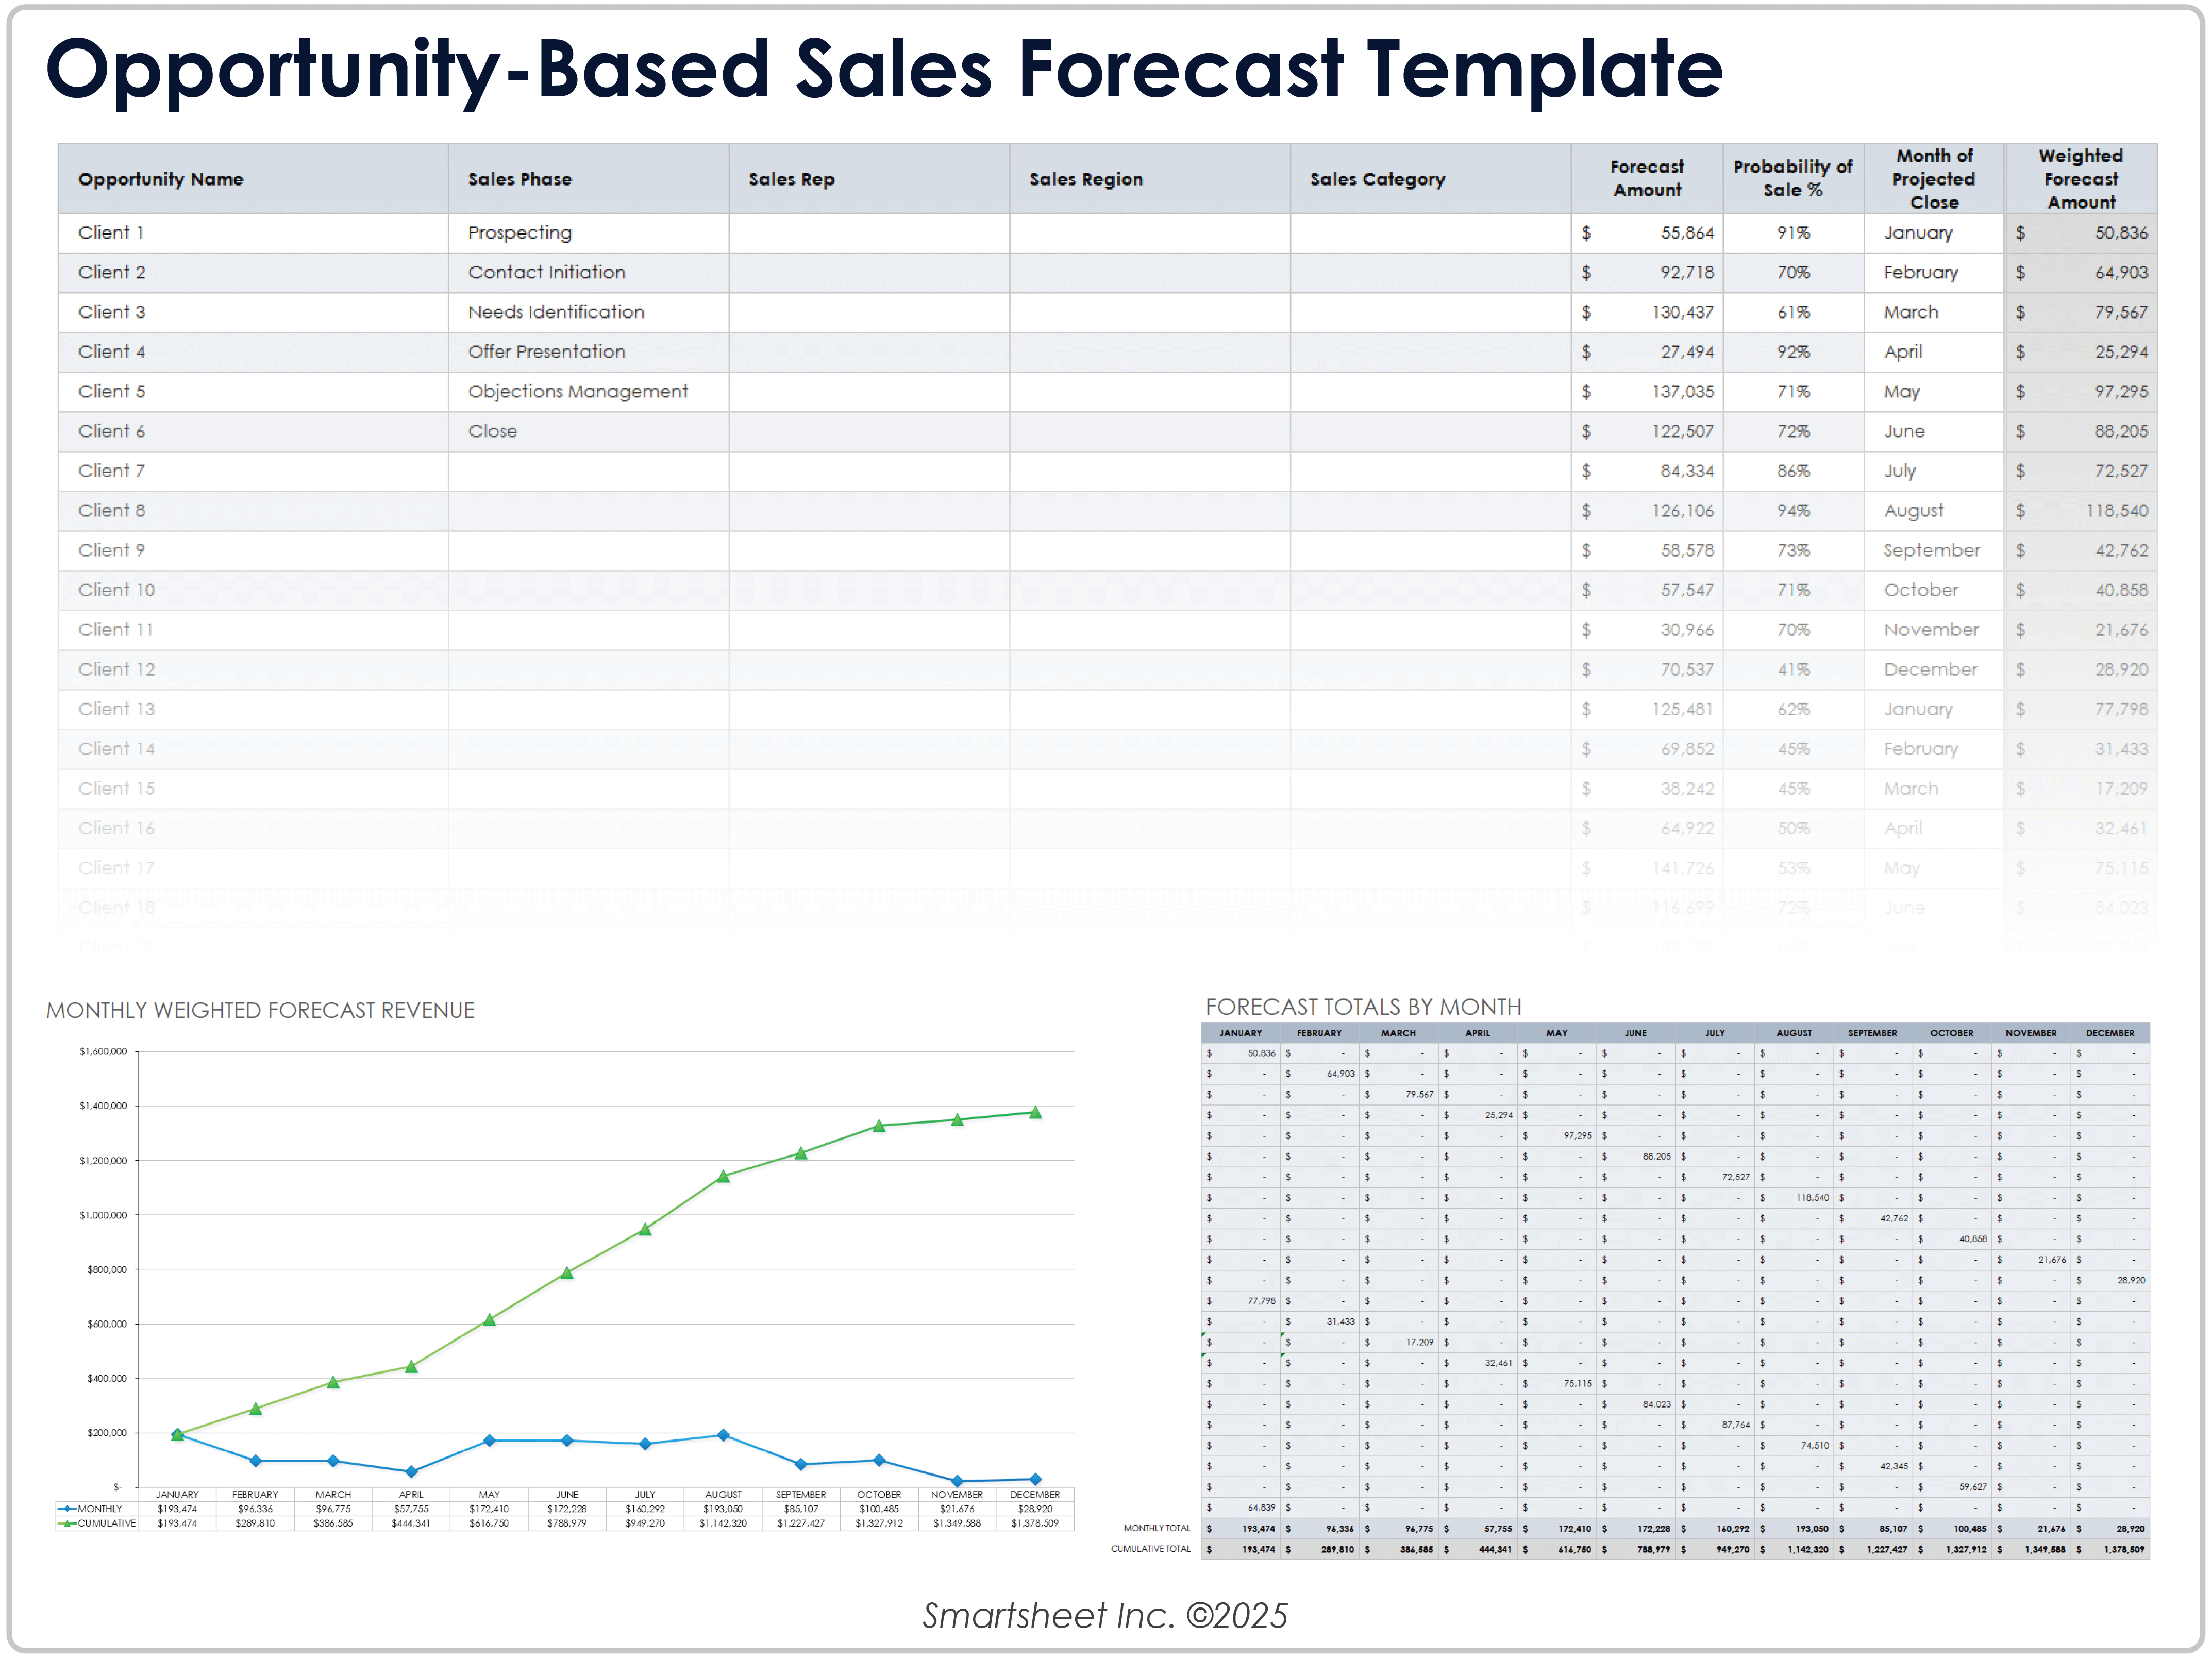
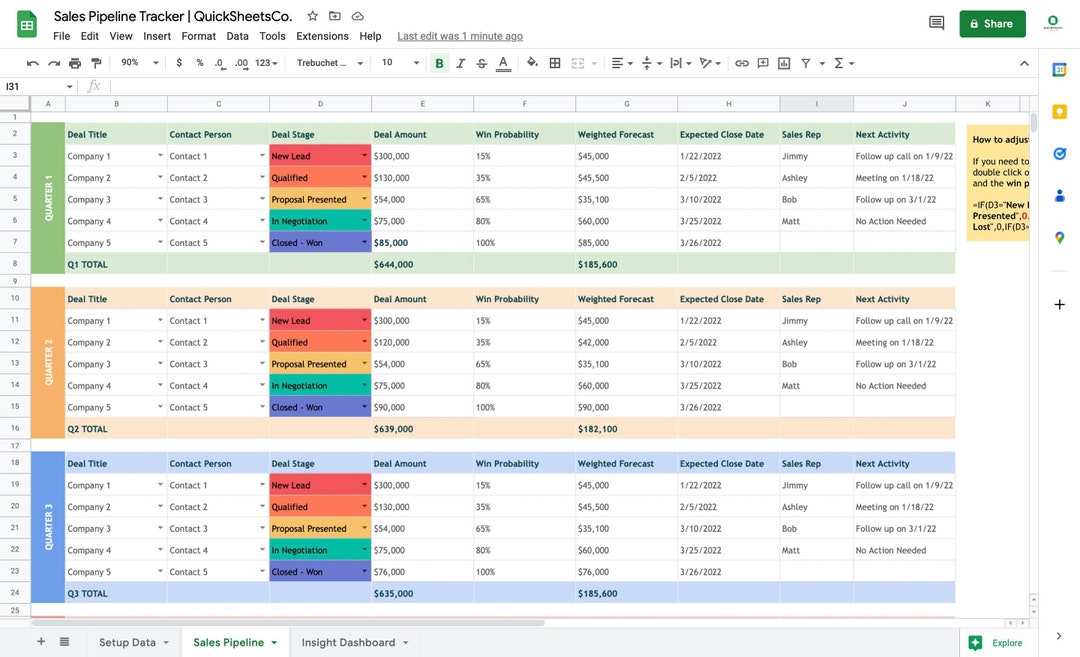
Pipeline-weighted forecasting approaches the problem from open opportunities. Each opportunity has a value, an expected close period, and often a probability associated with its sales stage. A weighted amount can be calculated by multiplying opportunity value by an appropriate probability. This method can be practical for B2B organizations with defined sales stages, but the probability should reflect actual historical conversion behavior rather than arbitrary optimism.
Bottom-up forecasting starts with operational drivers. A retailer might estimate traffic, conversion rate, average transaction value, and operating days. A subscription business might model new customers, churn, expansion, and recurring revenue. A service business might model billable capacity, utilization, average project value, and delivery timing. Bottom-up forecasting can be more transparent because every major assumption is connected to an operational activity.
Historical forecasting versus pipeline forecasting
Historical data is strongest when the underlying business model is stable. If the same products are sold through the same channels to similar customers, previous periods can provide a useful reference point. However, a historical average should not be treated as an automatic prediction. A major price change, new competitor, supply constraint, product launch, market contraction, or change in customer acquisition can make older patterns less representative of the coming period.
Pipeline forecasting is more immediate because it reflects specific opportunities expected to close. Its weakness is data quality. Stale opportunities, unrealistic close dates, inconsistent sales stages, or inflated deal values can make a weighted forecast look precise while remaining unreliable. The method therefore works best when opportunity stages have clear definitions and sales teams update the underlying records consistently.
Many businesses benefit from using both methods. Historical performance can establish a baseline, while pipeline data can explain near-term changes. If the historical model says next quarter should produce one level of revenue but the current qualified pipeline implies another, the difference becomes a management question. The purpose is not to force the two models to agree. It is to understand why they disagree and decide which assumptions deserve investigation.

Building a product-level forecast
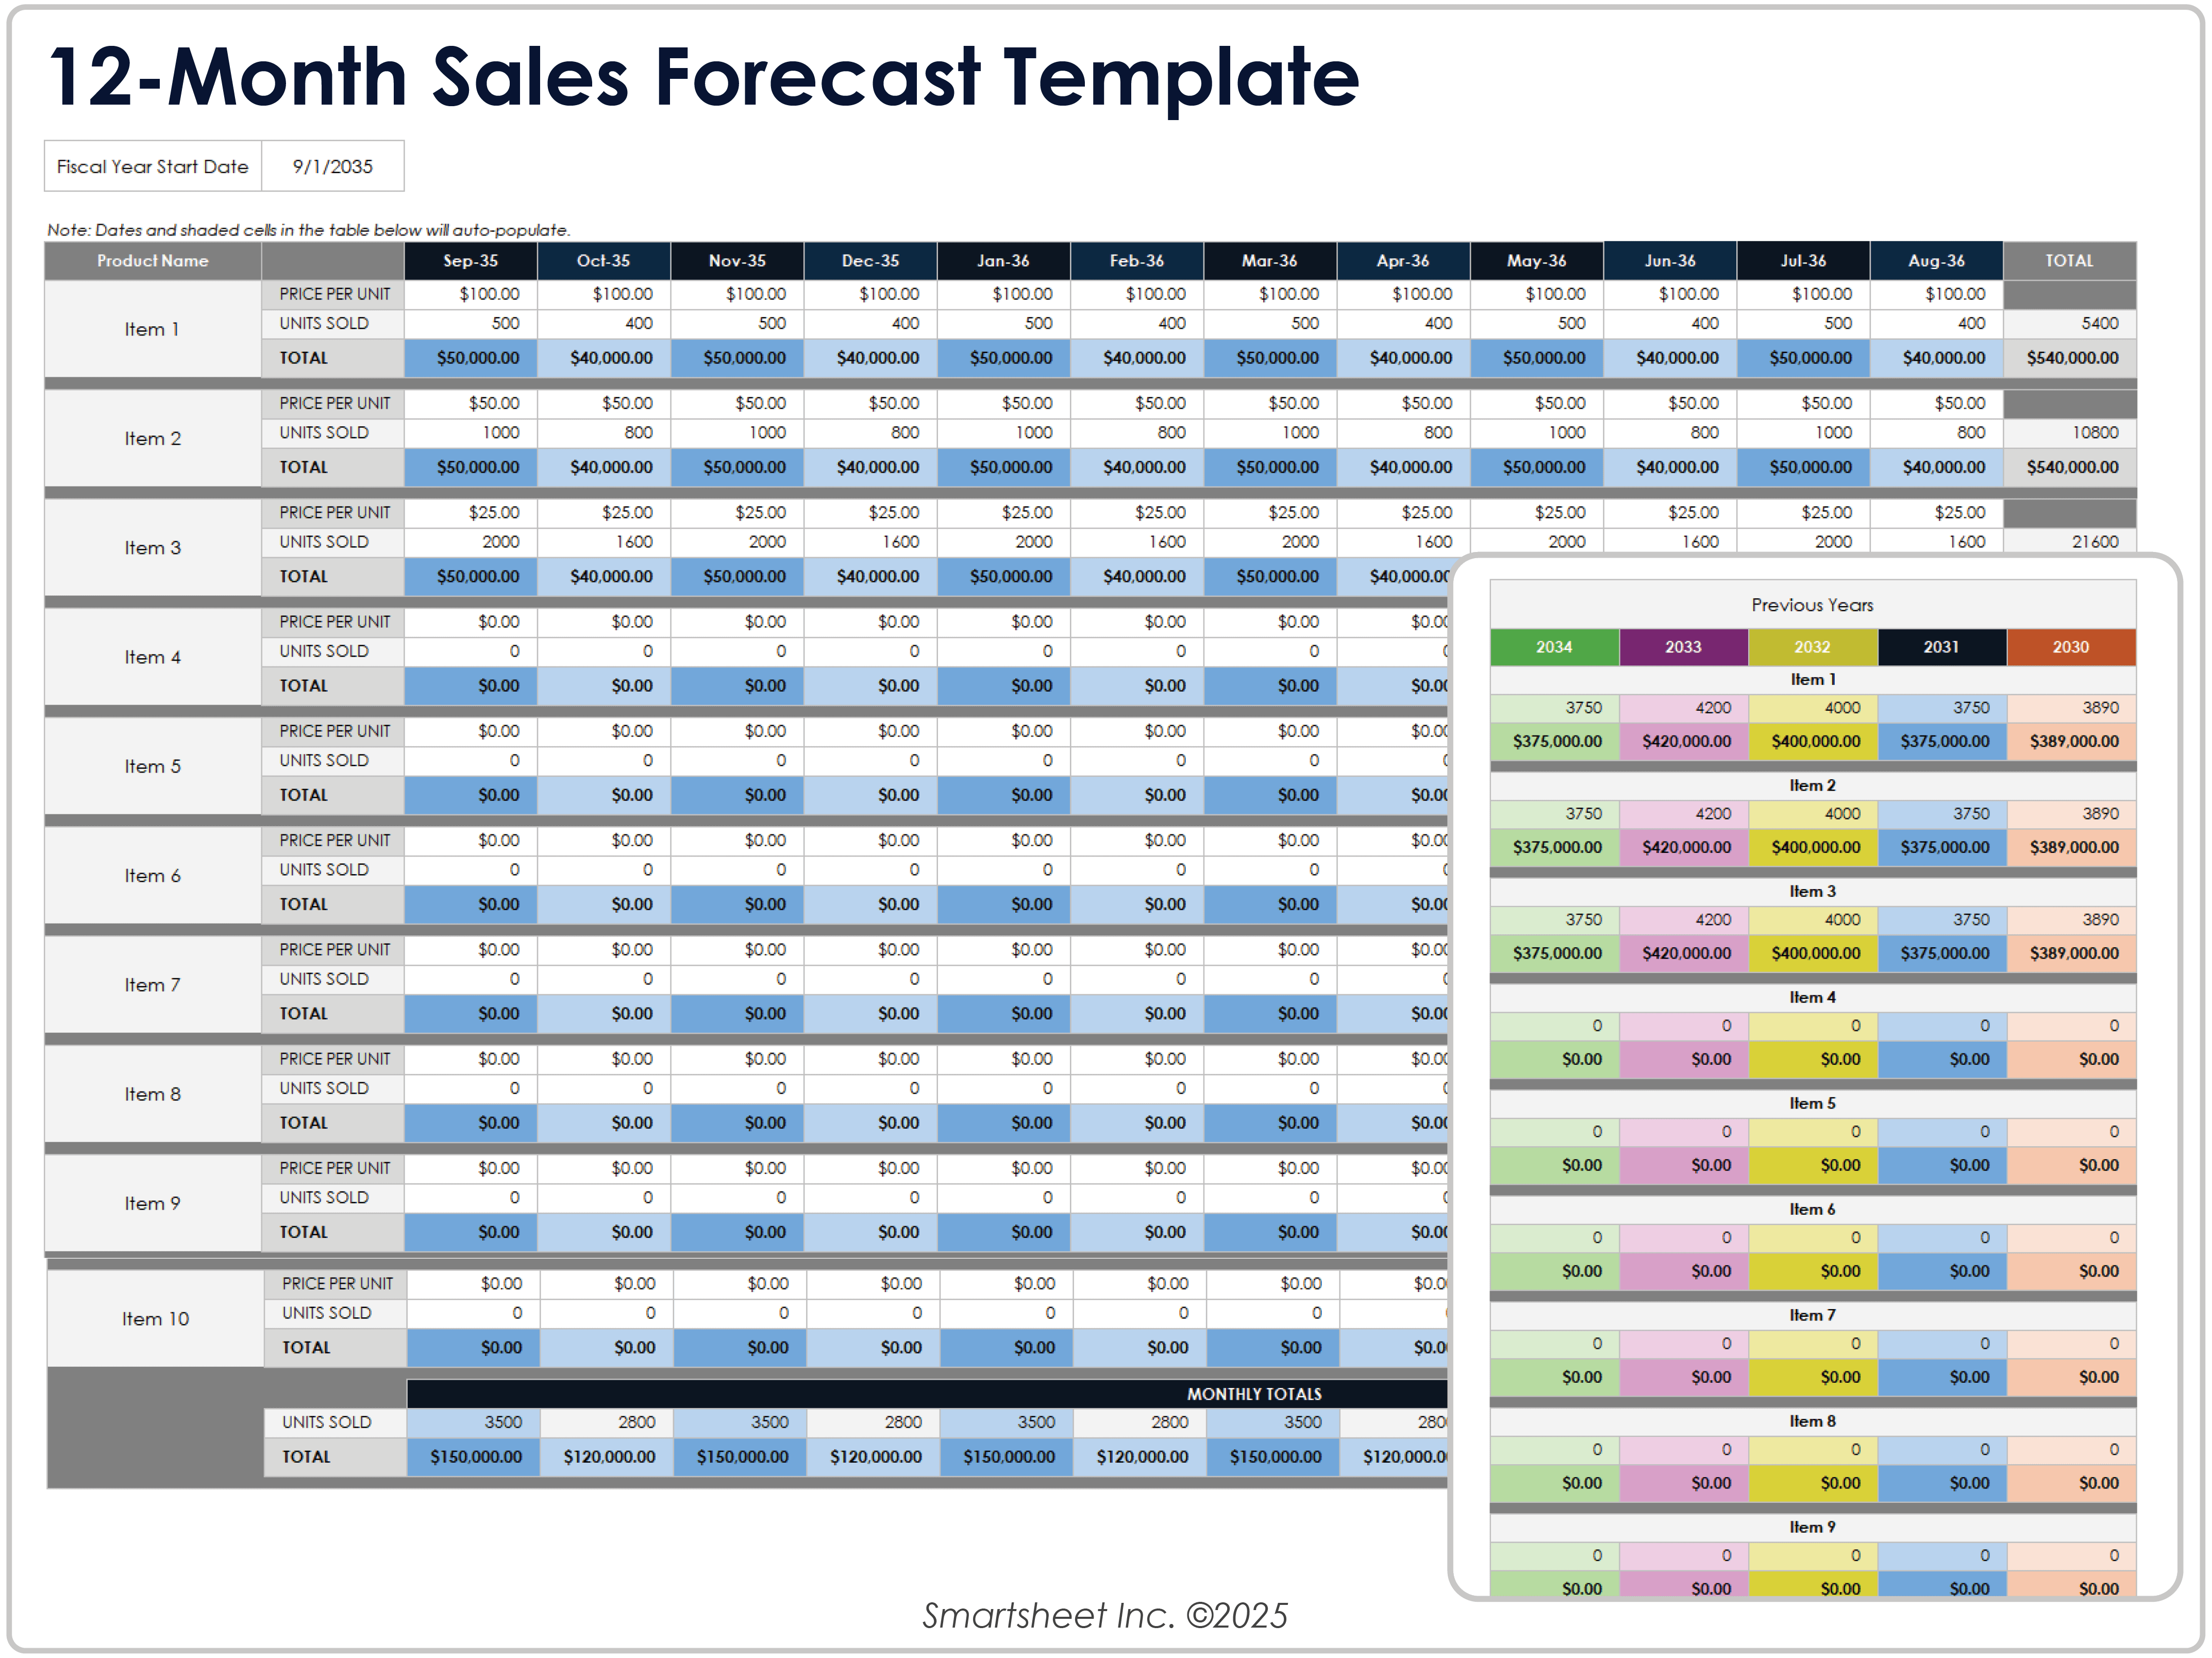
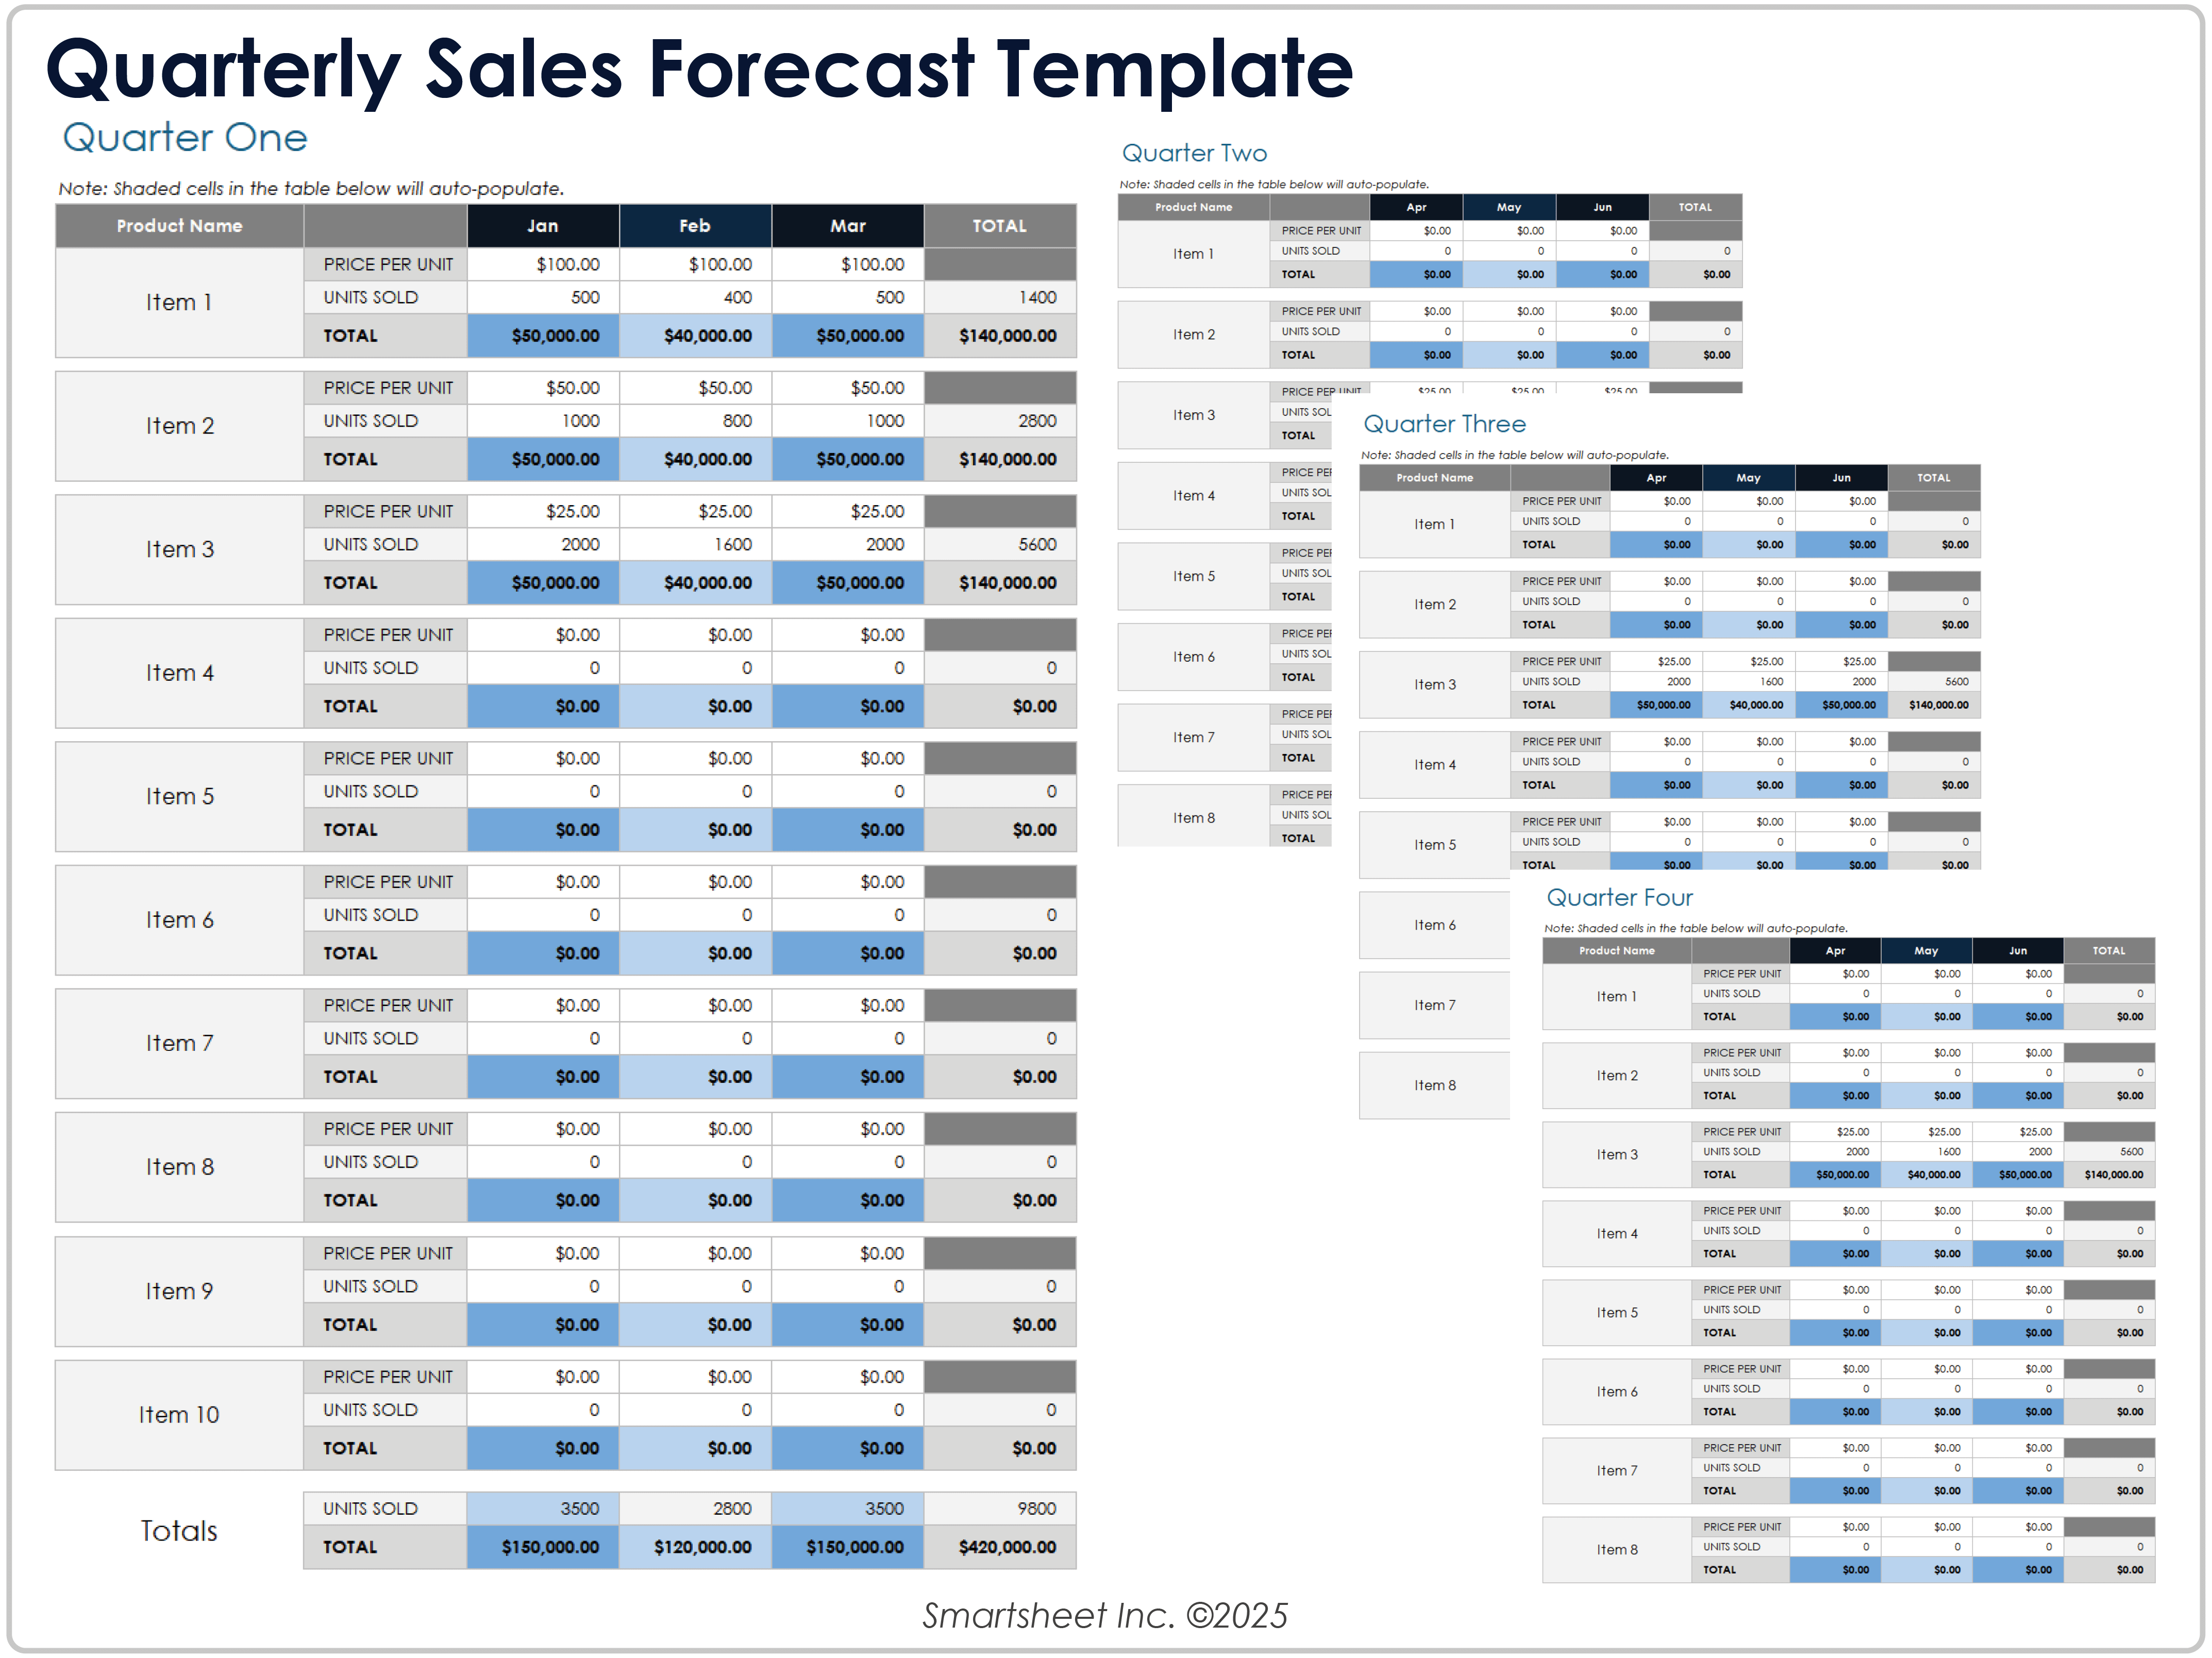
A product-level structure is useful when different products have different prices, demand patterns, margins, or growth rates. Instead of forecasting total company revenue as one line, create a row for each meaningful product or service. Each row can then contain monthly or quarterly unit assumptions, price assumptions, and calculated revenue. This structure makes it easier to identify which offerings are responsible for growth or underperformance.
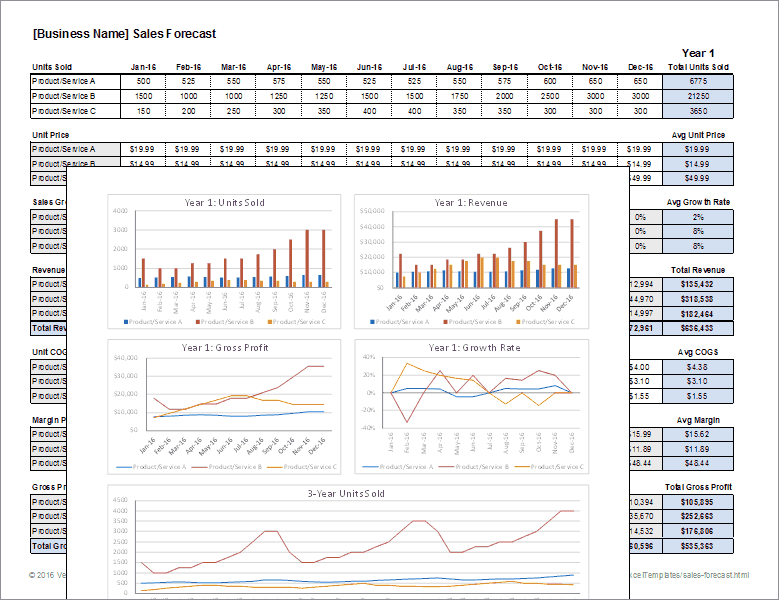
For example, consider a hypothetical business selling three products. Product A may have a high selling price but lower volume, Product B may have moderate price and steady demand, and Product C may be a lower-priced high-volume item. The forecast should not simply apply one company-wide growth percentage to all three. If each product behaves differently, its assumptions should reflect those differences. The example is hypothetical, but the modeling principle is broadly useful.
A product-level model can also support pricing analysis. If units are expected to remain constant while price increases, the revenue effect becomes visible. Conversely, a discount may increase unit volume while reducing revenue per unit. By separating volume and price, the forecast can show the trade-off rather than hiding it inside a single revenue estimate.

Using monthly, quarterly, and annual views together
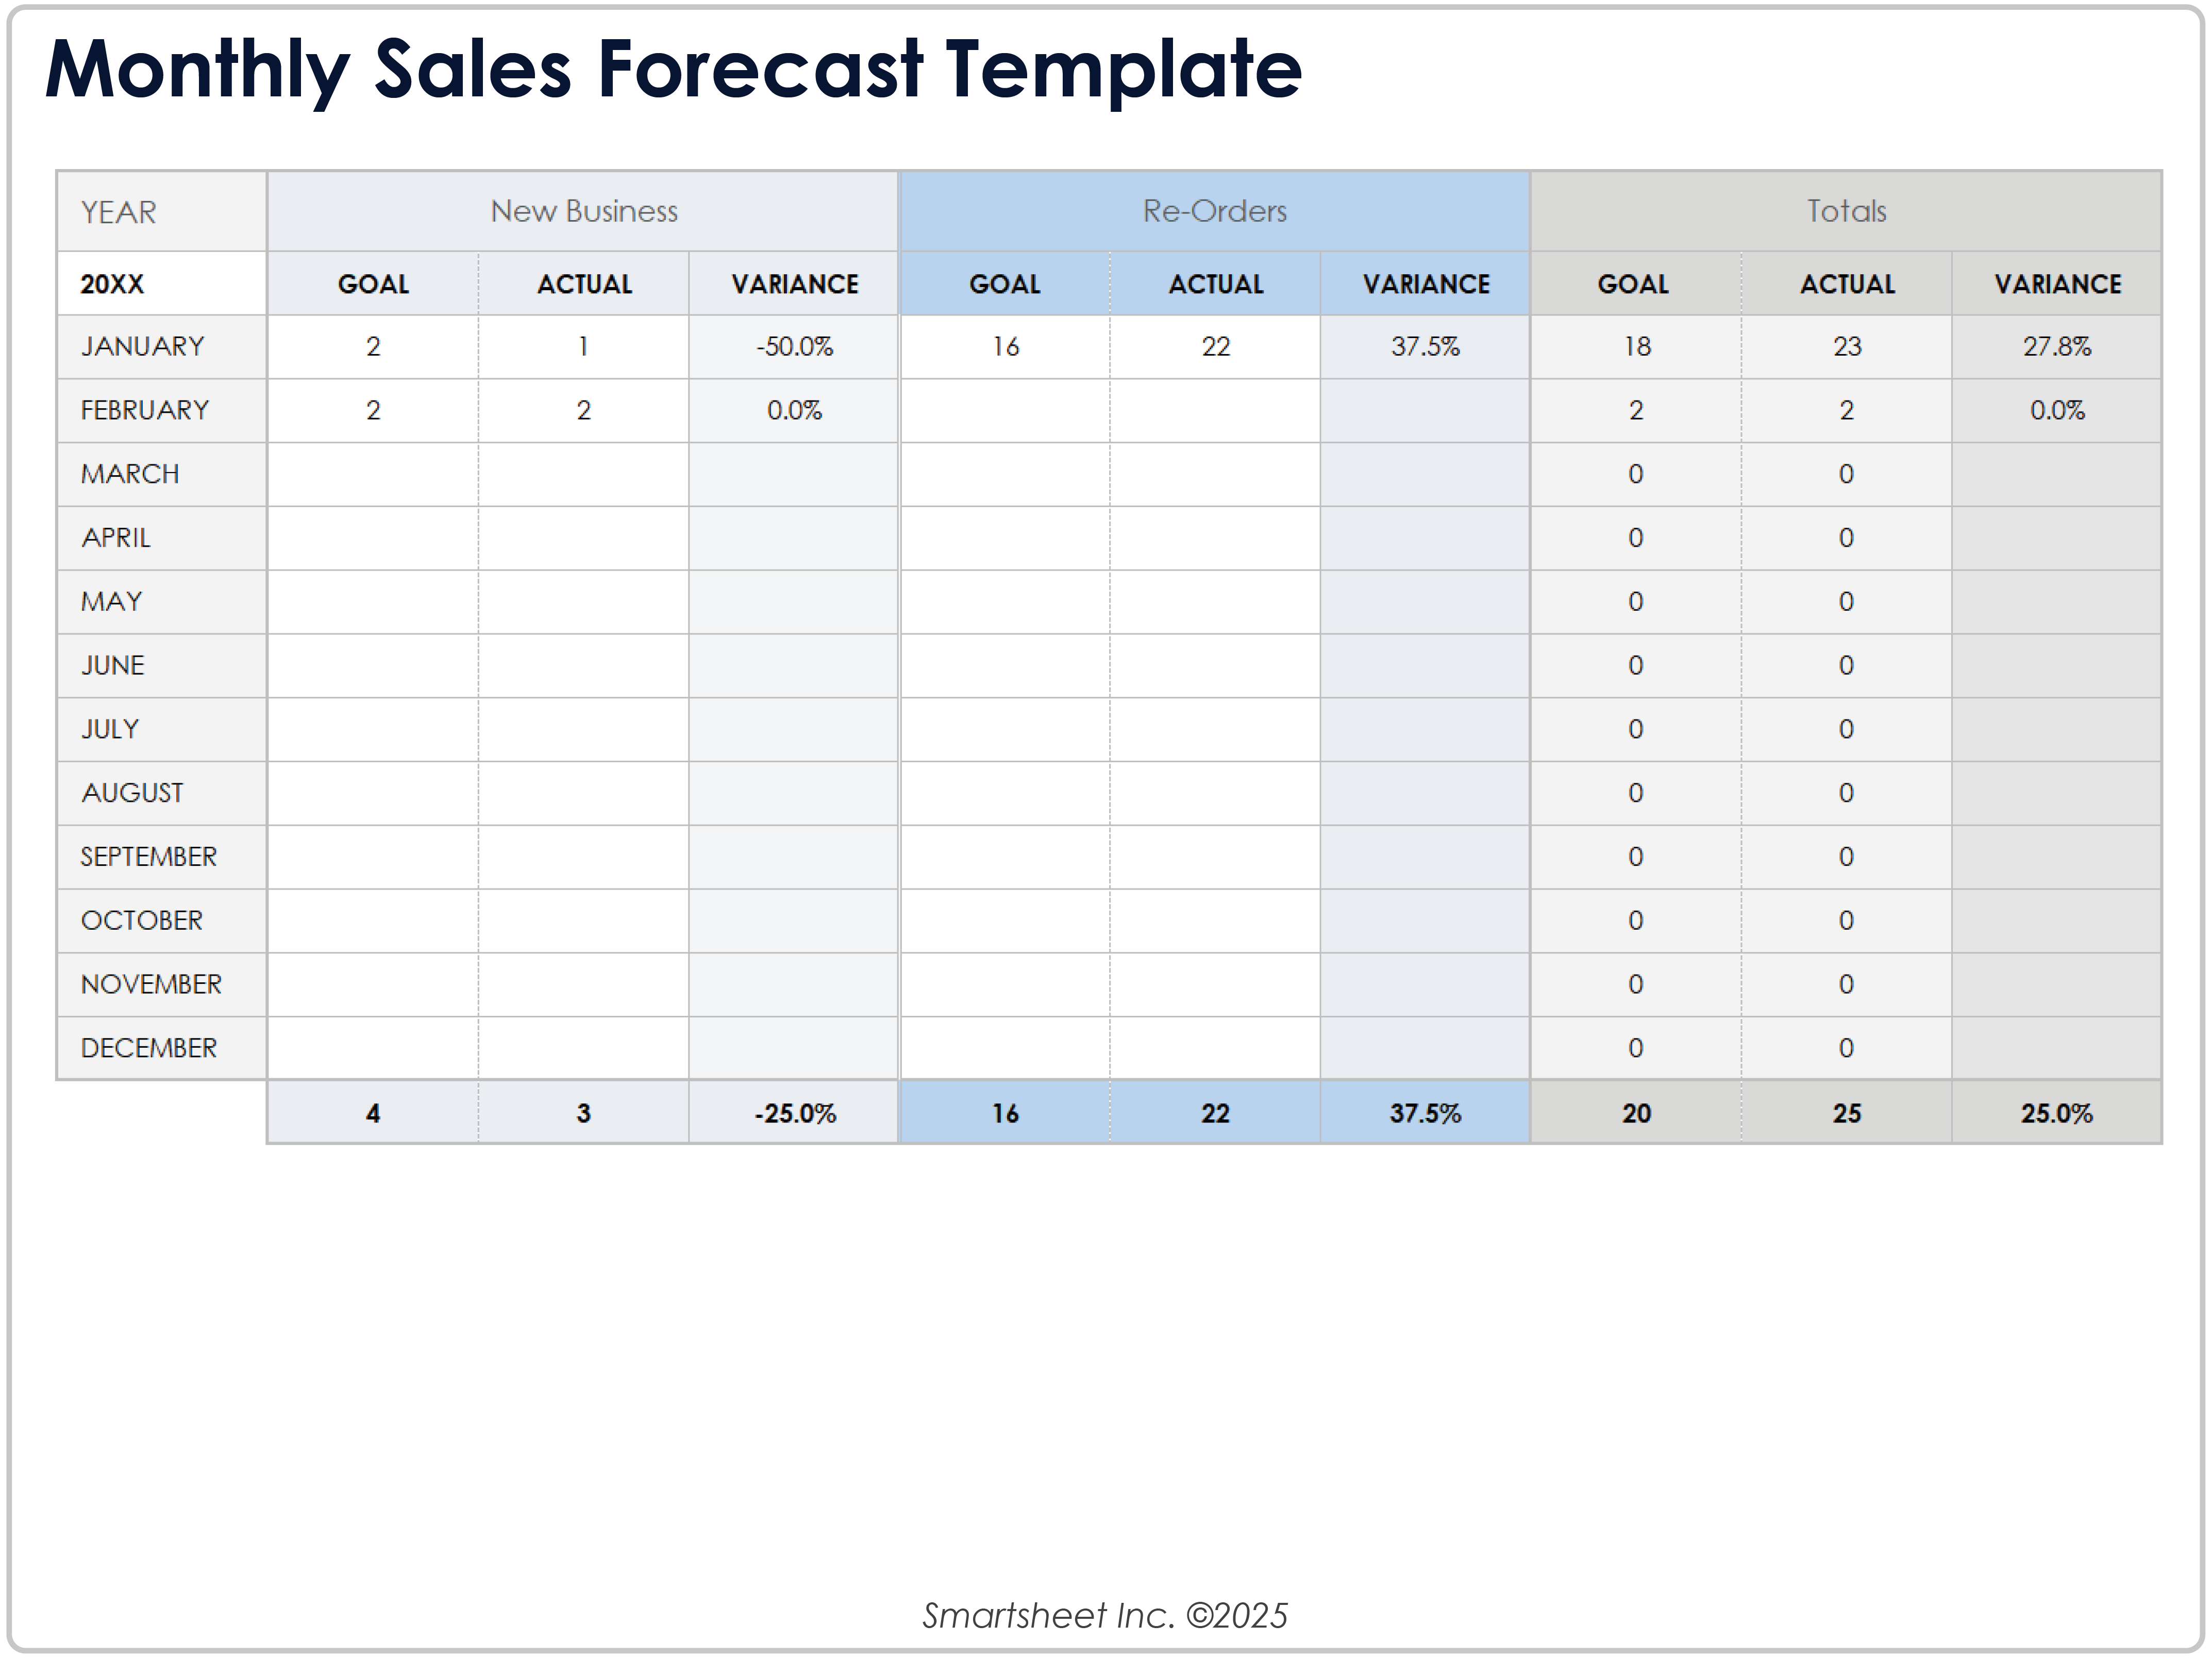
Monthly forecasting is valuable because it reveals timing. Two businesses can have identical annual revenue but very different cash and capacity requirements if one receives most of its sales early in the year and the other receives them late. Monthly columns make seasonal patterns, campaign effects, inventory requirements, and changes in sales momentum easier to see.
Quarterly summaries provide a more stable management view. They reduce the visual noise that can occur when individual months fluctuate sharply. A quarterly forecast can be particularly useful for board reviews, investor discussions, resource planning, and comparing performance against quarterly targets. The underlying monthly data should still remain available so that unusual quarterly results can be traced back to individual periods.
Annual totals provide the strategic view, but they should be treated as an aggregation rather than the only forecast. A useful annual number should be built from smaller assumptions that management can inspect. This is also why a forecast should preserve both the detailed period data and the summary totals. When actual results differ from the annual expectation, the business can investigate the timing and drivers rather than simply observing that the year was above or below target.
Spreadsheet formats and when to use them
A business sales forecast template google sheets format can be useful when several people need to review the same model and the business values shared access. A spreadsheet stored in a collaborative environment can make review easier, especially when sales and finance need to work from the same assumptions. The important issue is not the brand of spreadsheet platform; it is whether the structure, formulas, permissions, and update process are reliable.
A business sales forecast template excel format is often suitable when the model needs extensive formulas, established financial workflows, offline editing, or integration with existing spreadsheet-based reporting. An sales forecast template excel structure is particularly practical when the company already maintains historical sales data in spreadsheet workbooks. For teams comparing alternatives, a business sales forecast template pdf can be useful as a presentation or printable reference, but a static document is less suitable for ongoing calculations than a working spreadsheet.
Searchers also commonly look for a business sales forecast template free or a sales forecast template excel free because they want to test the forecasting process before committing resources to a more sophisticated system. There are also searches for a business sales forecast template free download, a download business forecast template, and a sales forecast template excel resource. When evaluating any such resource, inspect the formulas, assumptions, licensing terms, update date, and whether the format actually matches the business model before relying on it.
What makes a template better than a blank spreadsheet
A blank spreadsheet provides flexibility but places all of the design responsibility on the user. A well-designed template establishes a consistent vocabulary for products, periods, units, prices, revenue, assumptions, and actual results. That consistency matters when more than one person contributes to the forecast. If one person enters gross sales while another enters net sales after discounts, the resulting model may appear complete while combining incompatible measures.
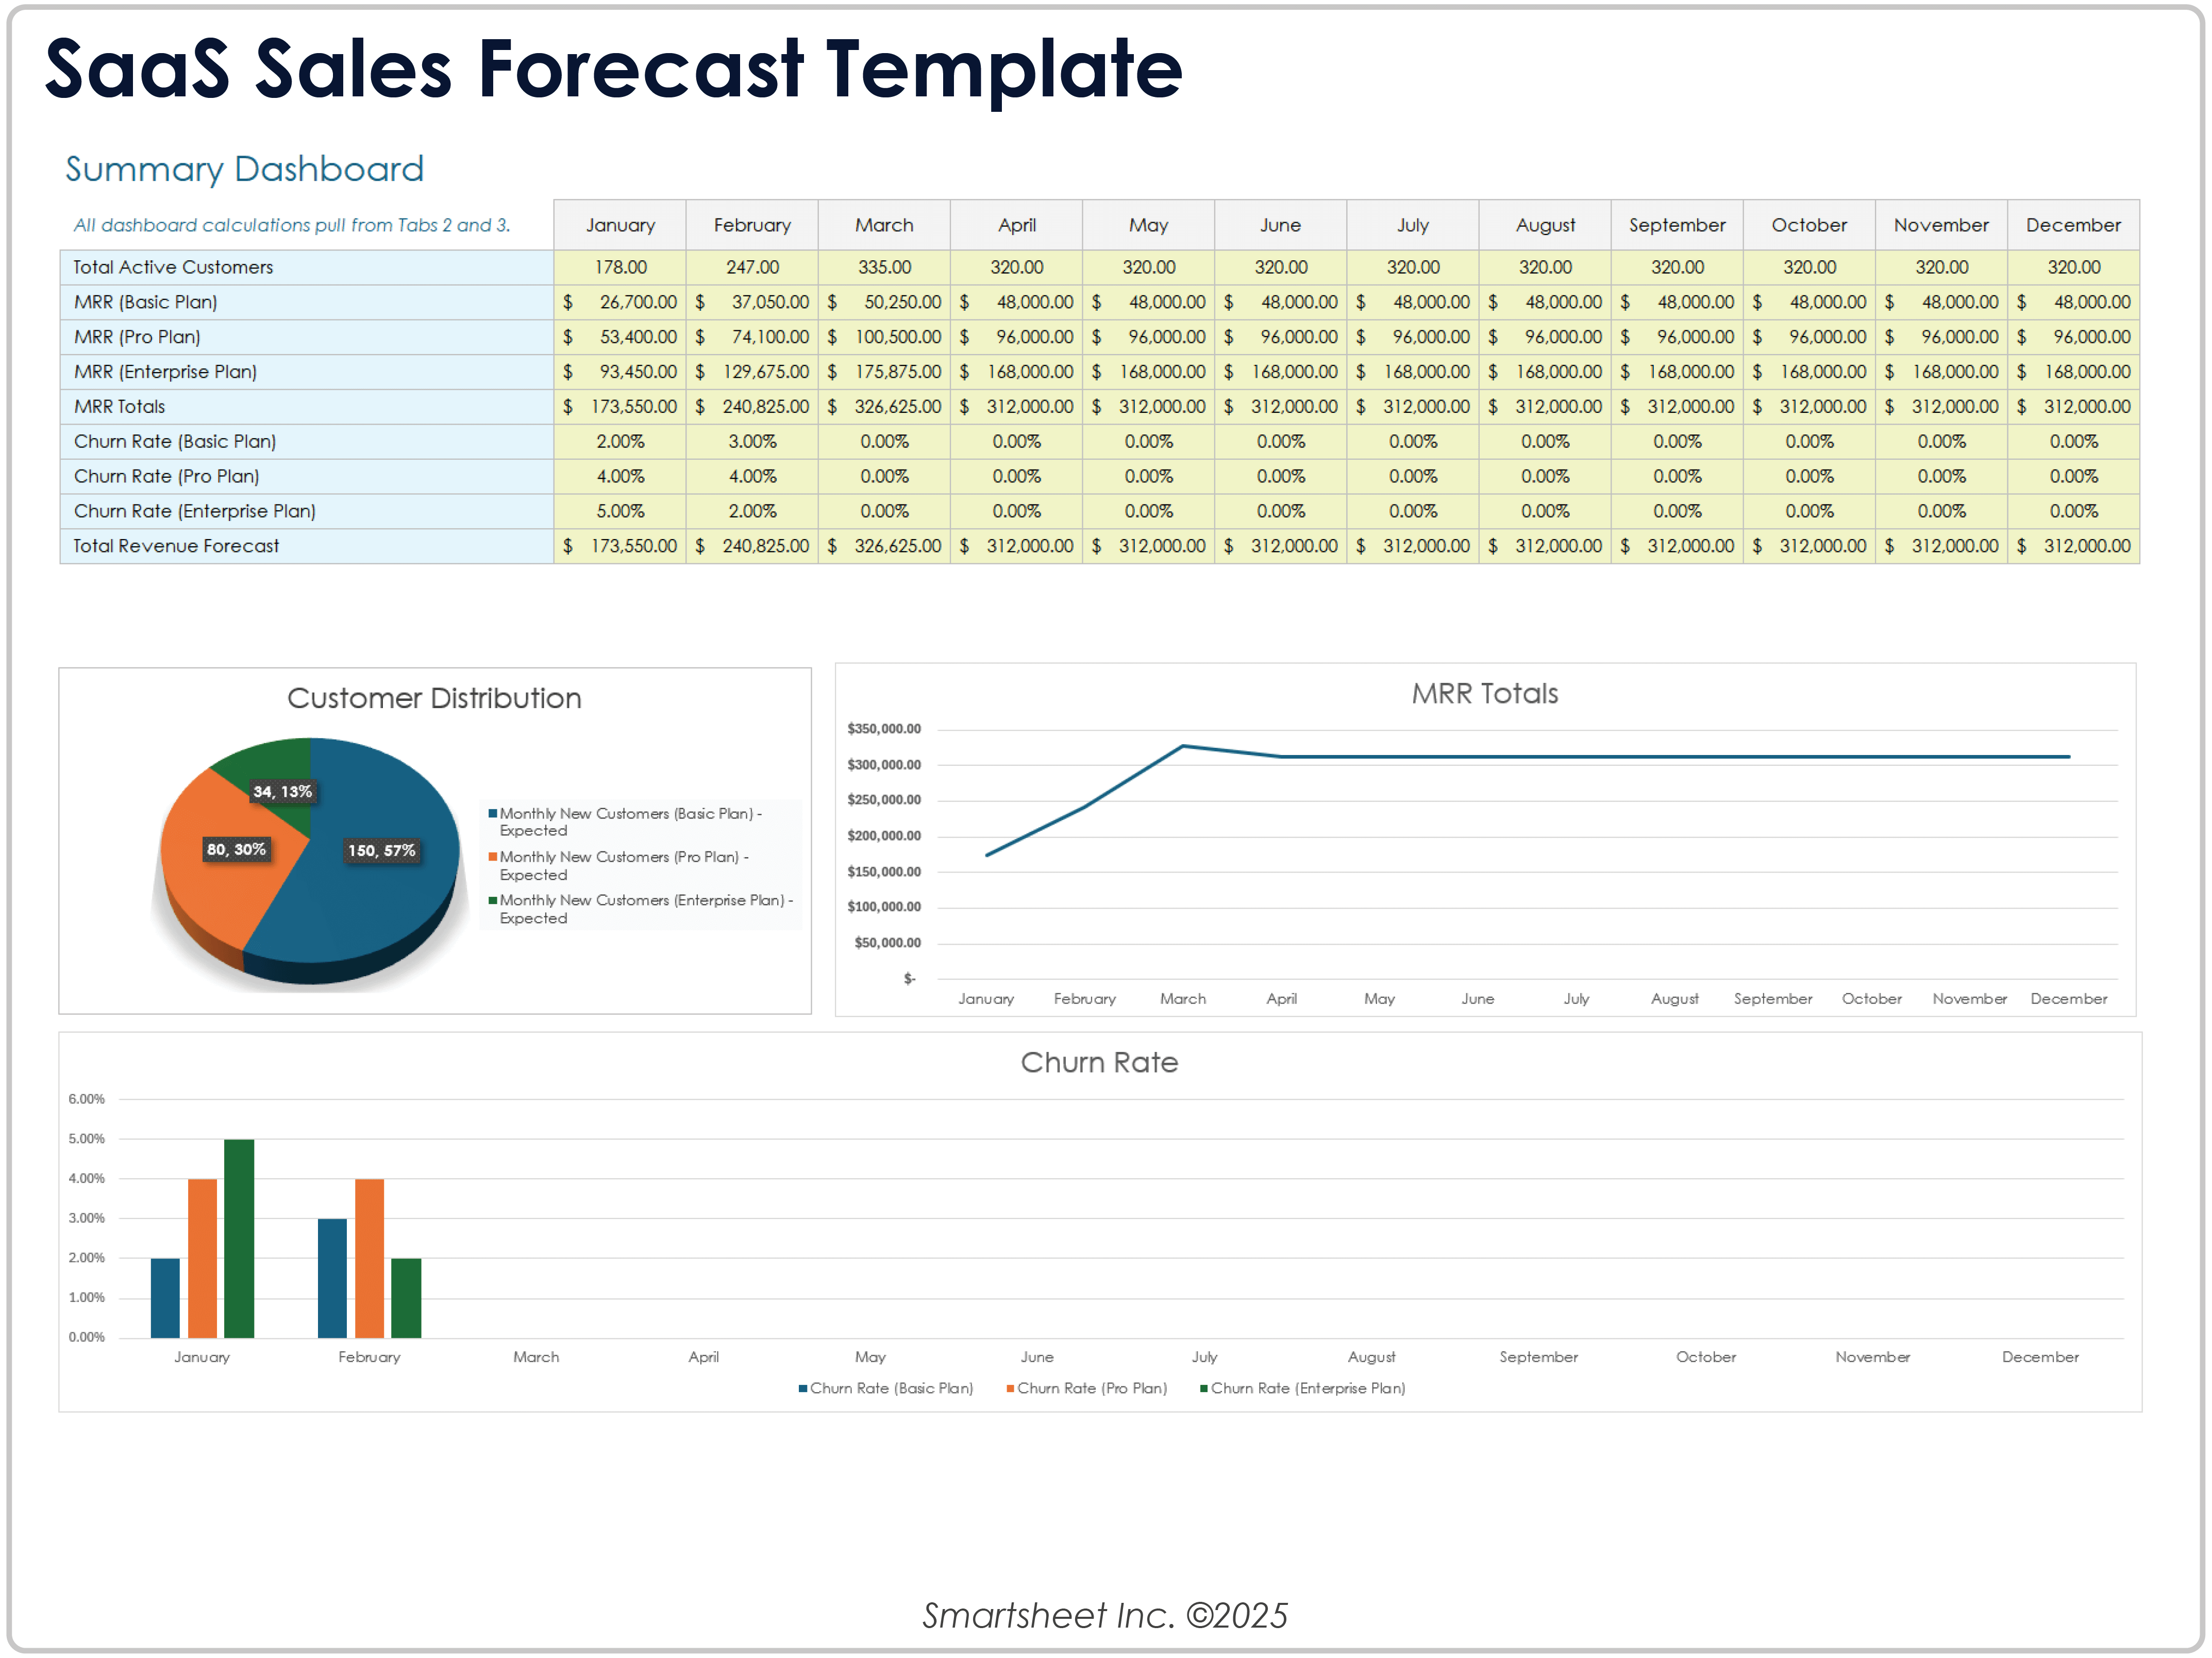
The best sales forecast template is therefore not necessarily the most elaborate one. It is the one that matches the decisions the business needs to make. A small company with ten products may need a straightforward product-by-month model. A sales organization with many active opportunities may need deal stage, probability, expected close date, owner, and weighted value. A subscription business needs recurring revenue and churn logic rather than a simple unit-sales table.
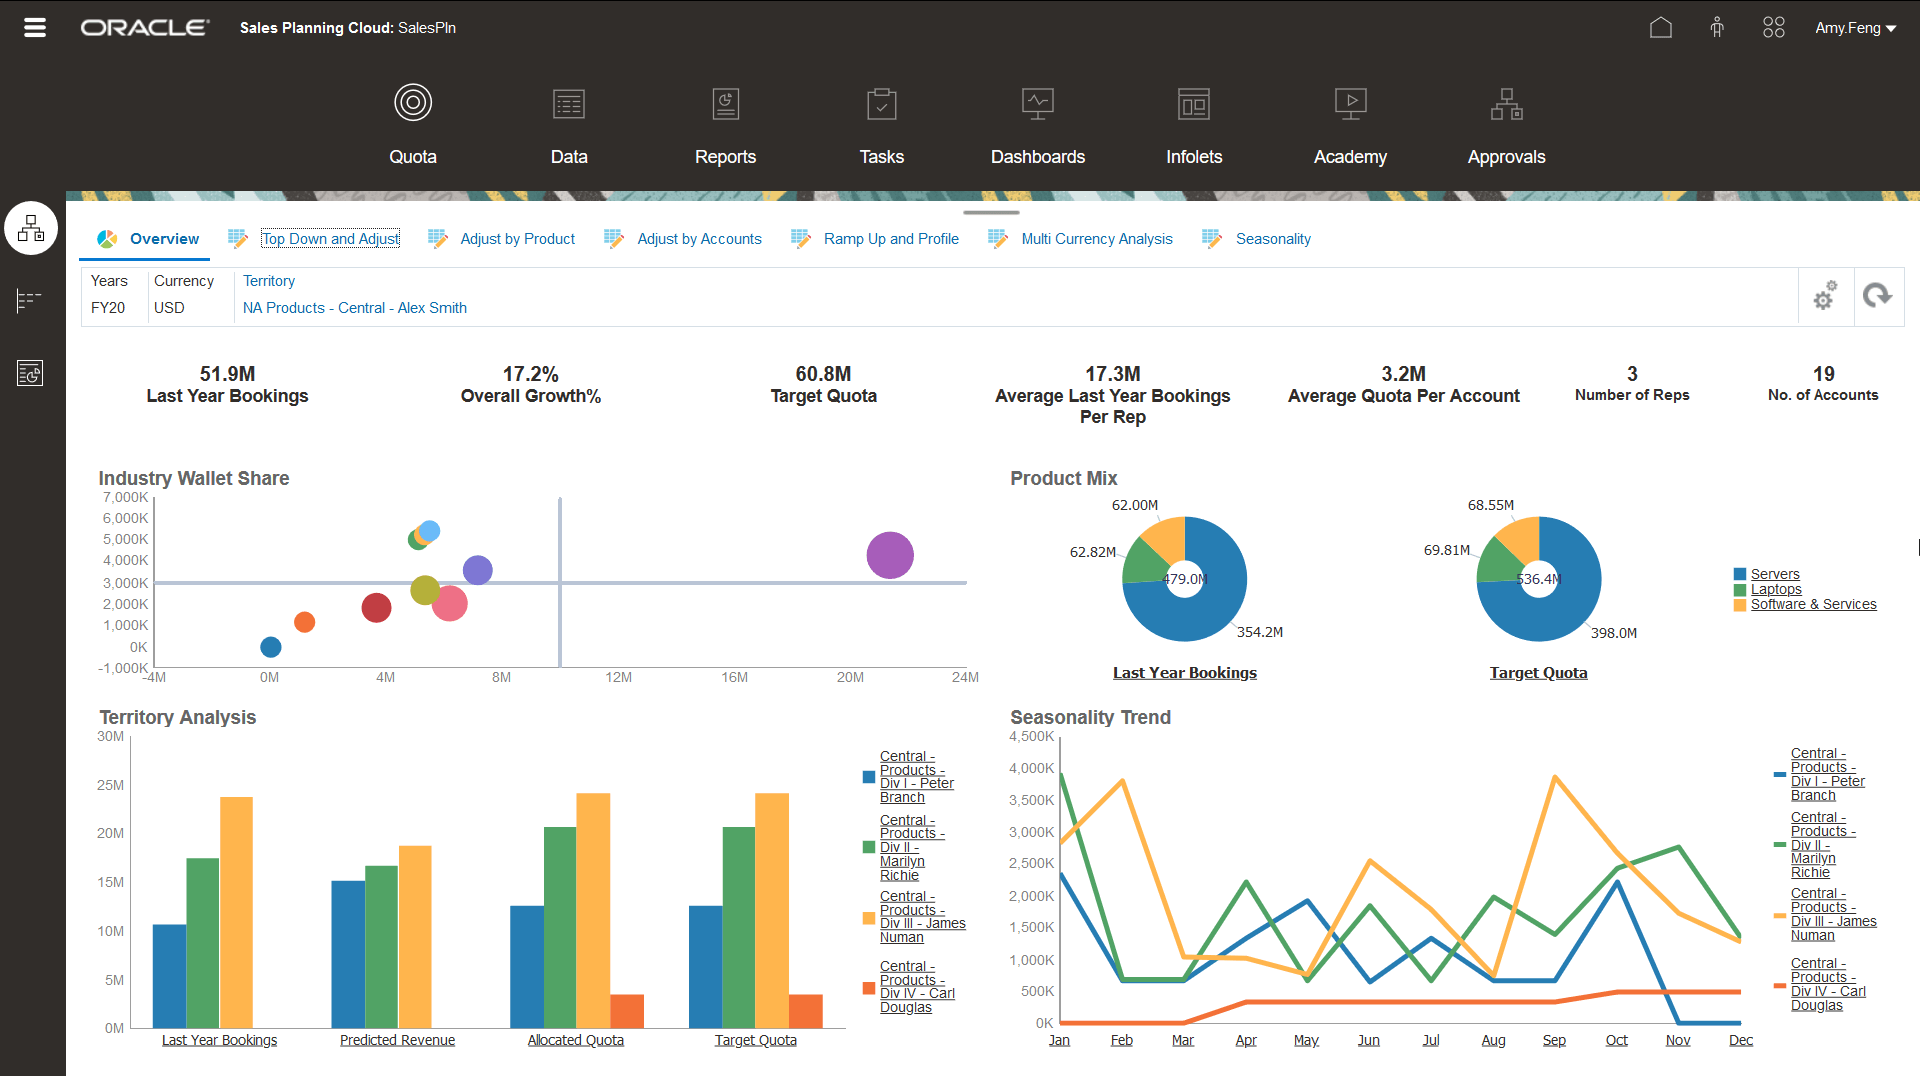
Look for formulas that are easy to inspect, clearly labeled assumptions, visible totals, and an obvious distinction between historical actuals and future estimates. Charts can be useful when they reveal something the table does not immediately show, such as seasonality, forecast-versus-actual gaps, product concentration, or changing margins. Decorative dashboards are less valuable if they do not help answer a business question.
How sales forecasts fit into a business plan
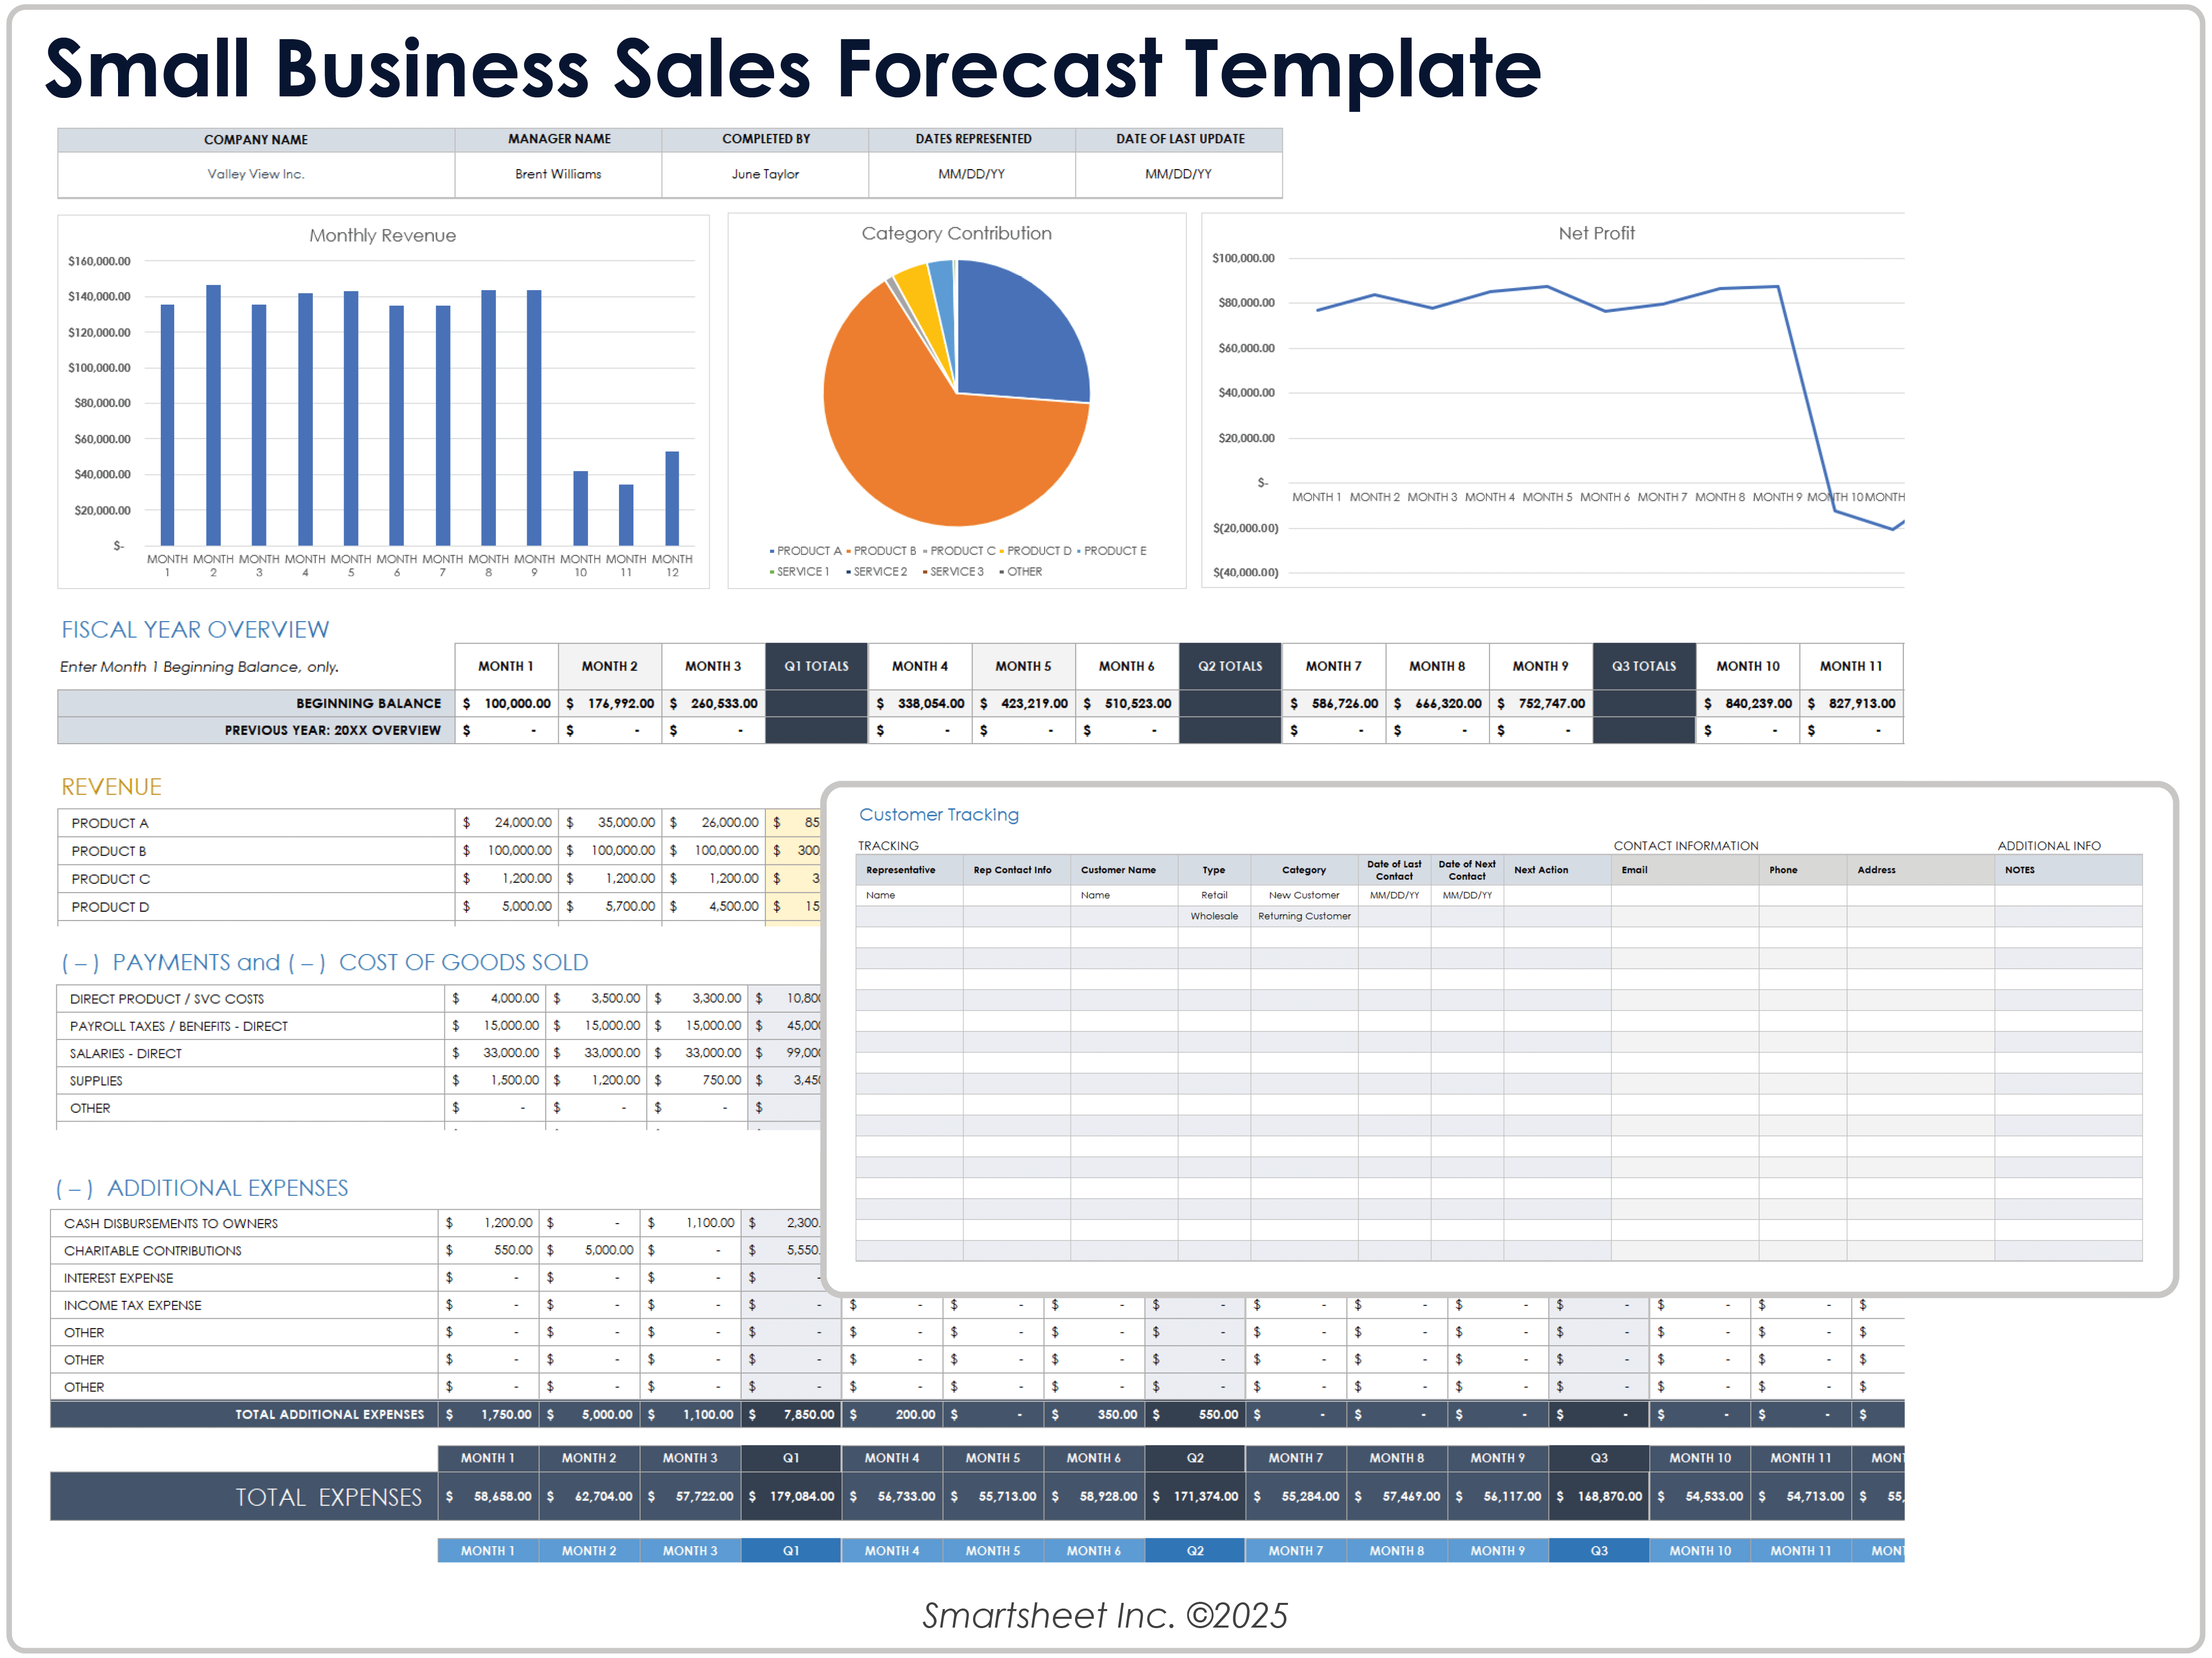
A sales forecast is one part of the financial logic behind a business plan. It should connect with the market opportunity, product strategy, pricing, marketing plan, staffing assumptions, operating capacity, and financial statements. If the business plan says the company will expand into a new region, the forecast should show the expected sales effect and the assumptions behind that expansion. If the marketing plan assumes a major increase in qualified demand, the sales model should explain how that demand becomes customers and revenue.
An example of sales forecast in business plan material often includes monthly or quarterly projections for units, prices, and revenue, followed by annual totals. A stronger business-plan forecast also explains the assumptions behind those figures. For example, management might explain that a projection assumes a particular number of sales representatives, an estimated sales cycle, a planned price, a defined number of new accounts, and a reasonable conversion rate. Those assumptions make the forecast easier for lenders, investors, partners, or internal decision-makers to evaluate.
The SBA notes that financial projections should support the broader business plan and recommends more detailed projections for the first year when preparing financial information for funding purposes. The forecast should therefore agree with other financial statements. If the sales forecast says revenue will be a certain amount but the projected income statement uses another amount, the discrepancy should be resolved before the plan is presented.
How to handle product sales and services
A product sales forecast template works best when physical or digital products can be represented by measurable units and prices. A product row might contain forecast units for each month, the expected selling price, and calculated revenue. Additional rows can capture cost of goods sold and gross margin when profitability is important. Products with very different sales patterns should generally remain separate rather than being blended into one average assumption.
Services may require a different driver. A consulting company might forecast billable hours, projects, retainers, or contracts. A repair business could use jobs completed and average ticket value. A professional services company might need to model both new business and recurring client work. The template should follow the economic engine of the business rather than forcing every company into a retail-style units-times-price structure.
Mixed businesses can use separate sections for product revenue, service revenue, recurring revenue, and other income. The sections can then roll into a total revenue line. This approach makes the forecast easier to interpret because a change in total revenue can be traced to the appropriate stream. It also prevents an unusually strong service month from masking weak product sales, or vice versa.
Using opportunity data without overstating revenue
Opportunity forecasting is especially useful when revenue depends on a defined sales pipeline. Each opportunity can have a name, sales stage, value, expected close month, probability, and weighted amount. The weighted value can provide a baseline estimate, but it should not be interpreted as guaranteed revenue. A probability is an estimate of likelihood, not a promise that a customer will buy.
Stage definitions should be evidence-based. A deal should not enter a late stage merely because a salesperson feels optimistic. Clear criteria might include confirmation of budget, a defined decision process, an agreed commercial proposal, or another observable milestone. Consistent stage definitions make historical conversion rates more meaningful and reduce the risk that different team members interpret the same stage differently.
Review stale opportunities regularly. An opportunity with an old close date, no recent progress, or an unresolved commercial issue may be inflating the forecast. A practical review can classify deals into categories such as committed, likely, possible, or excluded. The precise labels can vary, but the principle is the same: make uncertainty visible instead of allowing every open opportunity to look equally credible.
Forecast accuracy: compare plan with actual results
A forecast becomes more useful when it is reviewed against what actually happened. Record the original forecast and the actual result for the same period rather than replacing the original estimate after the period ends. This creates a history of forecast performance. Over time, the business can identify whether it consistently overestimates volume, underestimates seasonality, misjudges close timing, or overlooks changes in price.
Variance should be investigated rather than merely reported. A revenue shortfall may come from fewer units, lower prices, delayed deals, higher cancellations, weaker conversion, or a product-mix change. The reason matters because each cause calls for a different response. A volume problem may require demand generation or sales execution work, while a pricing problem may require a commercial review.
Forecast accuracy should also be reviewed at the level where decisions are made. A company can hit its annual revenue number while missing several monthly targets, or hit total revenue while losing money on an important product category. Comparing forecast and actual results by period, product, channel, and major sales driver creates a more useful feedback loop than checking one annual percentage.
Scenario planning: conservative, base, and upside cases
One forecast can create a false sense of certainty. Scenario planning is more useful when the future contains meaningful uncertainty. A simple model can contain a conservative case, a base case, and an upside case. Each case should be driven by explicit assumptions rather than arbitrary percentage changes. For example, the cases might differ in unit volume, conversion rate, average selling price, or timing of major opportunities.
The conservative case should be plausible rather than deliberately pessimistic. It can represent weaker conversion, slower customer acquisition, delayed contracts, or lower average order value. The base case should represent the most defensible current expectation. The upside case can show what happens if key assumptions perform better than expected. None of these cases should be presented as a prediction with certainty; they are decision-making scenarios.
Scenario analysis becomes especially valuable when connected to capacity. If the upside case creates demand beyond production capacity, the business needs to know that before the demand arrives. Likewise, if the downside case creates a cash-flow problem, management can identify spending or hiring decisions that should be flexible. A forecast is most valuable when it changes a decision before the underlying event occurs.
Common mistakes that weaken a sales forecast
One common mistake is using a single growth percentage across every product and month. This is simple, but it can erase seasonality and differences in product maturity. Another mistake is mixing actual and forecast values without clearly labeling the transition point. A third is using inconsistent definitions for revenue, such as mixing gross bookings, invoiced revenue, and recognized revenue.
Another problem is excessive precision. A forecast that shows extremely precise numbers can look authoritative even when the underlying assumptions are uncertain. Precision in a spreadsheet does not create accuracy in the business. Round assumptions are often easier to explain, while detailed calculations should be reserved for areas where the underlying data genuinely supports that level of precision.
Finally, avoid building a forecast once and then leaving it untouched. The SBA notes that forecasts normally require revisions as results and conditions change. A forecast should be a living planning model. Establish a review cadence, record material assumption changes, compare actuals with the original forecast, and preserve enough history to learn from previous estimates.
Practical Solution
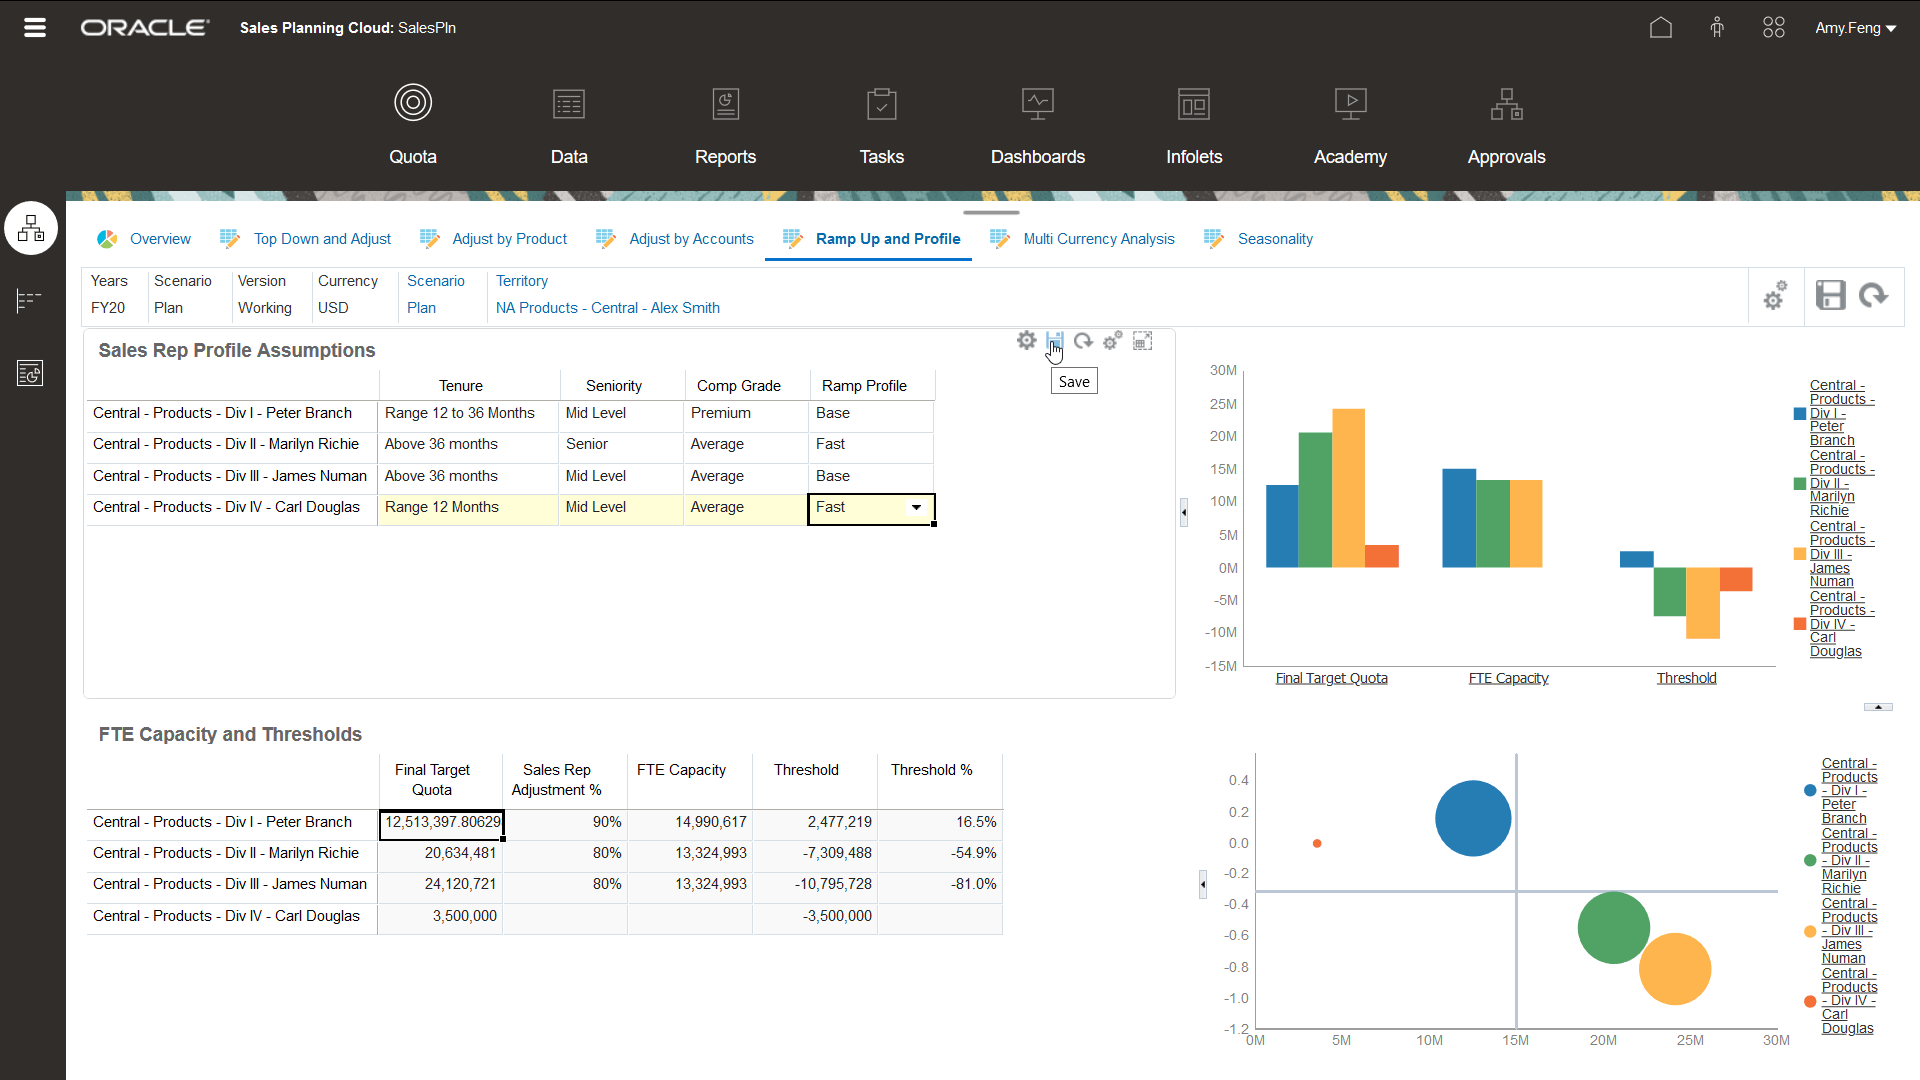
Start with a model that is small enough to maintain. Define the forecast period, list the products or services that materially affect revenue, and decide which sales drivers are measurable. For each line, enter the expected units or transactions, price or average value, and resulting revenue. Then add assumptions for seasonality, pricing changes, new products, major campaigns, or known contracts. Keep assumptions in clearly labeled cells or sections so they can be reviewed independently of calculated results.
Next, choose the forecasting method that best matches the available evidence. If the company has reliable historical sales, use those records to establish a baseline and examine seasonal patterns. If the business depends on a sales pipeline, add opportunity values, expected close periods, and evidence-based probabilities. If operational drivers are clearer than historical revenue, use a bottom-up model based on traffic, conversion, capacity, customers, transactions, or another measurable driver. For many businesses, a hybrid model is the most practical approach.
Then create three review layers: forecast, actual, and variance. Never overwrite the original forecast simply to make the model look current. At each review point, compare the forecast with actual performance and explain the largest differences. Update future assumptions when evidence supports the change, but preserve the original forecast so the organization can learn whether its forecasting process is improving. Finally, connect the resulting sales numbers to inventory, staffing, expenses, cash planning, and the financial section of the business plan.

Practical checklist for maintaining the model
A useful operating routine can be built around a short checklist. First, confirm that the forecast period is correct. Second, remove or reclassify obsolete opportunities. Third, check whether major prices or product assumptions have changed. Fourth, compare the latest forecast with the previous forecast so large movements are visible. Fifth, compare the prior forecast with actual performance. Sixth, record the reason for material changes rather than simply changing the numbers.
- Forecast definition: State exactly what revenue or sales measure the model represents.
- Time period: Use consistent months, quarters, or fiscal periods.
- Sales drivers: Separate volume, price, conversion, customers, or other meaningful drivers.
- Assumptions: Keep major assumptions visible and explainable.
- Actuals: Preserve historical forecast versions so accuracy can be measured.
- Variance: Investigate why actual results differ from expectations.
- Scenarios: Use alternative cases when uncertainty could materially affect decisions.
- Business-plan alignment: Ensure sales figures agree with the rest of the financial model.
The best forecast process is one that the organization can repeat. A sophisticated model that nobody updates is less useful than a simple model that is maintained consistently. Likewise, a highly visual dashboard cannot compensate for weak assumptions or poor underlying sales data. Structure the forecast around decisions, make uncertainty visible, and improve the assumptions as actual results provide new evidence.
Reference Examples
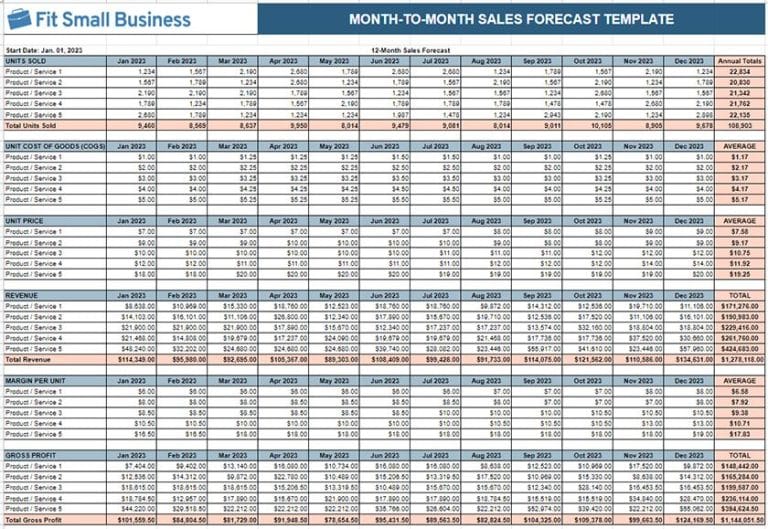
These reference examples show how a business sales forecast Template can be represented visually across different planning styles. Some examples emphasize monthly units and prices, while others focus on pipeline opportunities, recurring revenue, annual projections, or forecast-versus-actual analysis. The most useful visual structure depends on the business model and the decision the forecast needs to support. When reviewing an example, pay attention to the relationship between assumptions and calculated revenue, the level of detail, the period structure, and whether actual results can later be compared with the original forecast.
The following references are useful for evaluating the layout and information architecture of a business sales forecast Template. They are not interchangeable models: a daily worksheet serves a different purpose from a five-year projection, and a pipeline-weighted forecast serves a different purpose from a product-volume forecast. Use the visuals to recognize useful design patterns, then adapt the structure to the products, services, sales cycle, pricing, seasonality, and reporting requirements of the business being forecast.
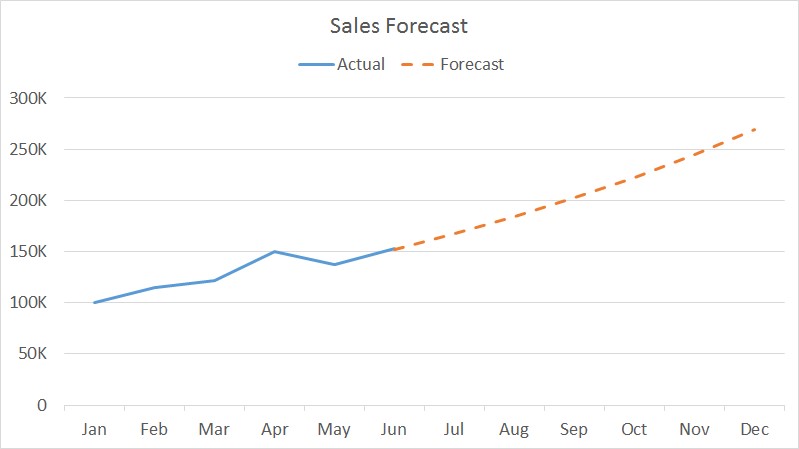
Sales Forecast Chart
Source: InGenium Web
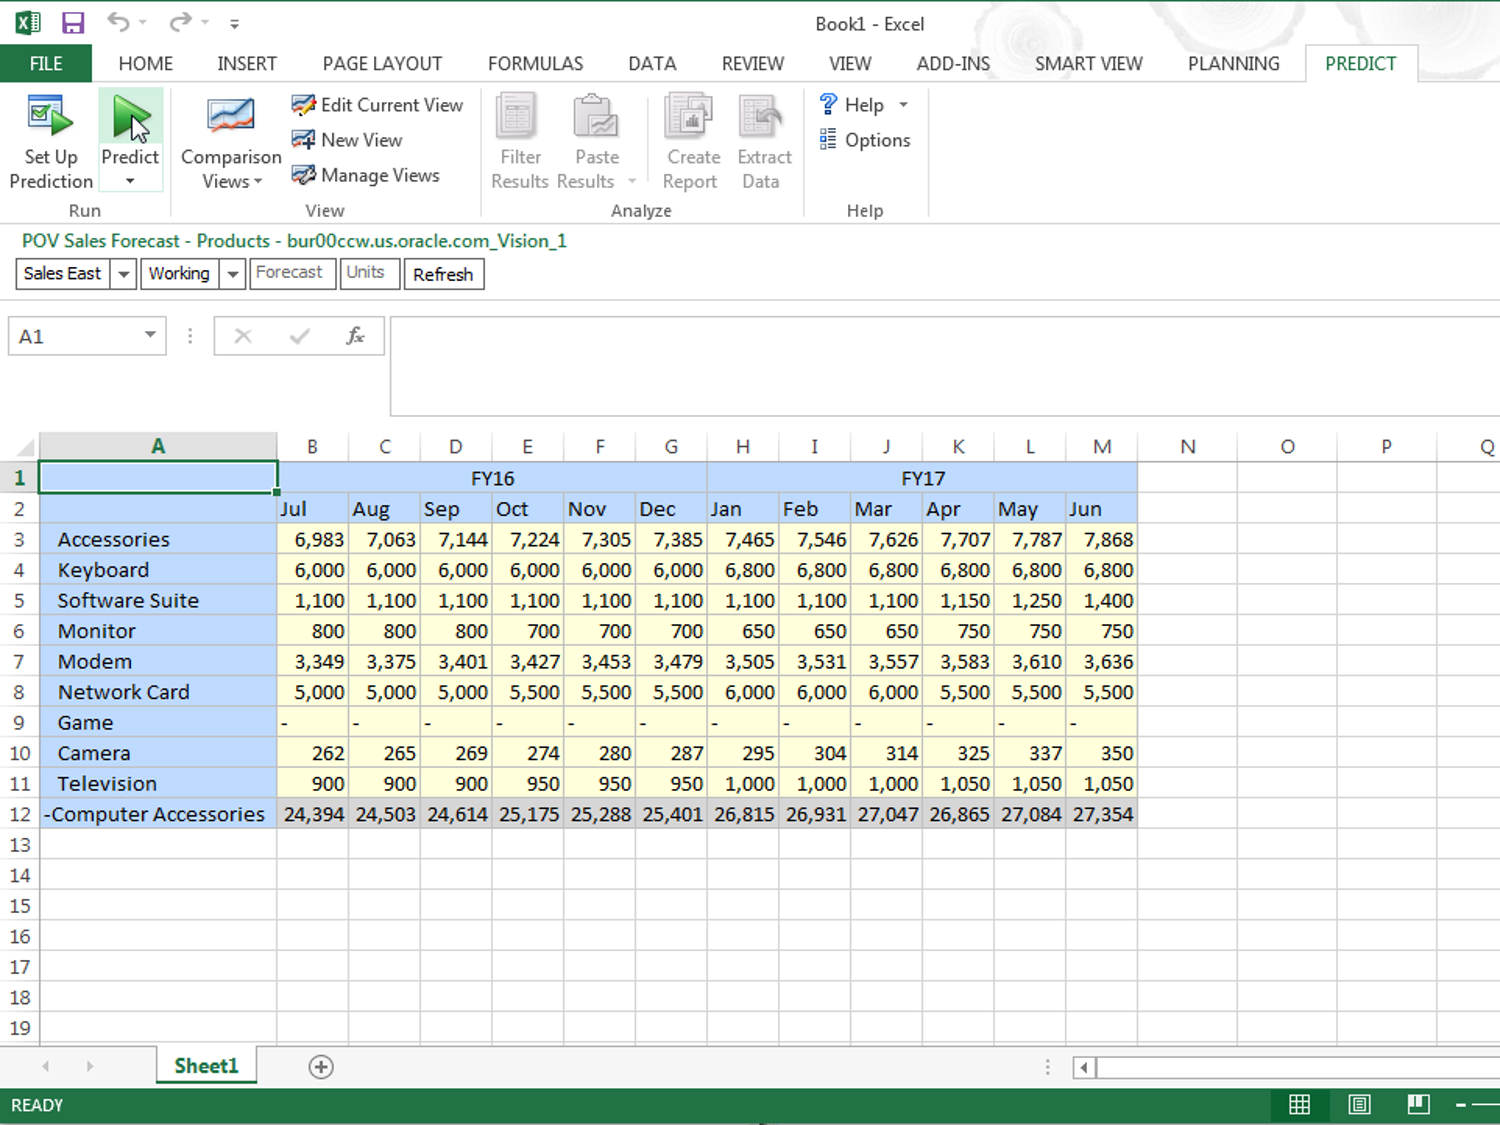
Monthly Sales Forecast Overview
Source: Oracle

ForecastEra Sales Dashboard
Source: Creatio

Predictive Planning Sales Forecast
Source: LinkedIn
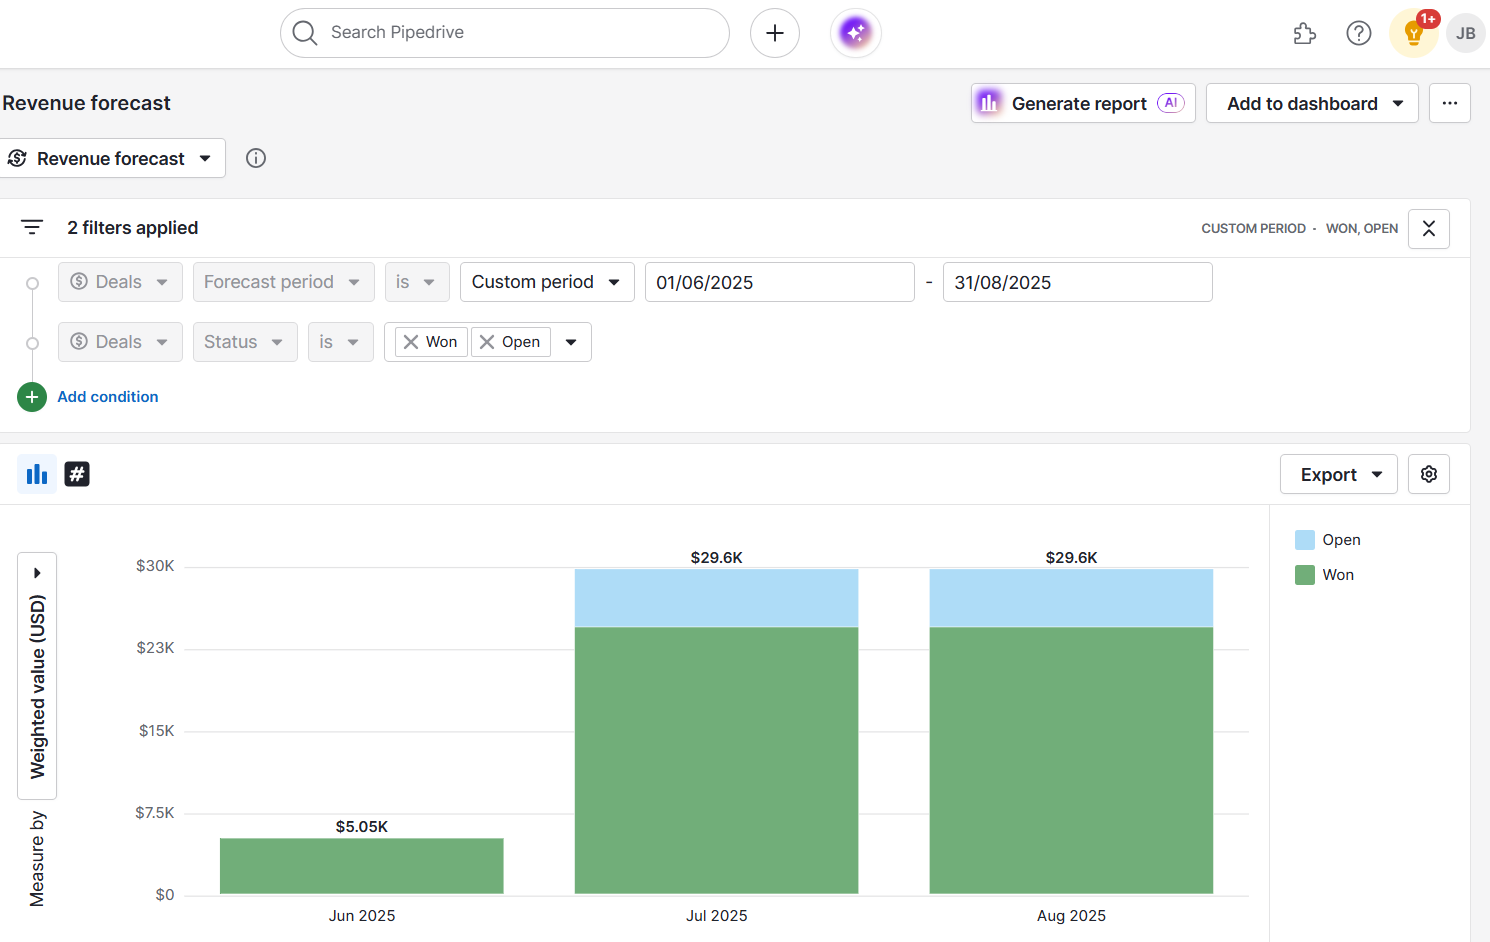
Pipedrive Revenue Forecast Dashboard
Source: Pipedrive
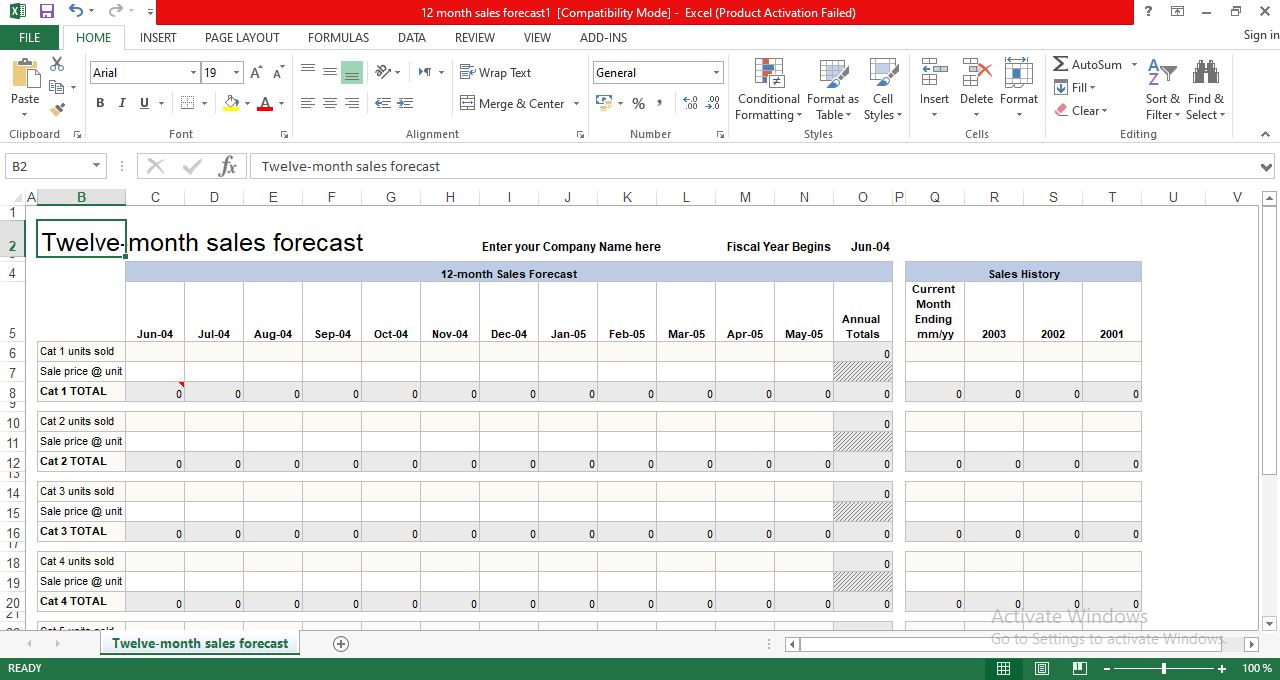
12-Month Sales Forecast Excel Template
Source: Blogspot
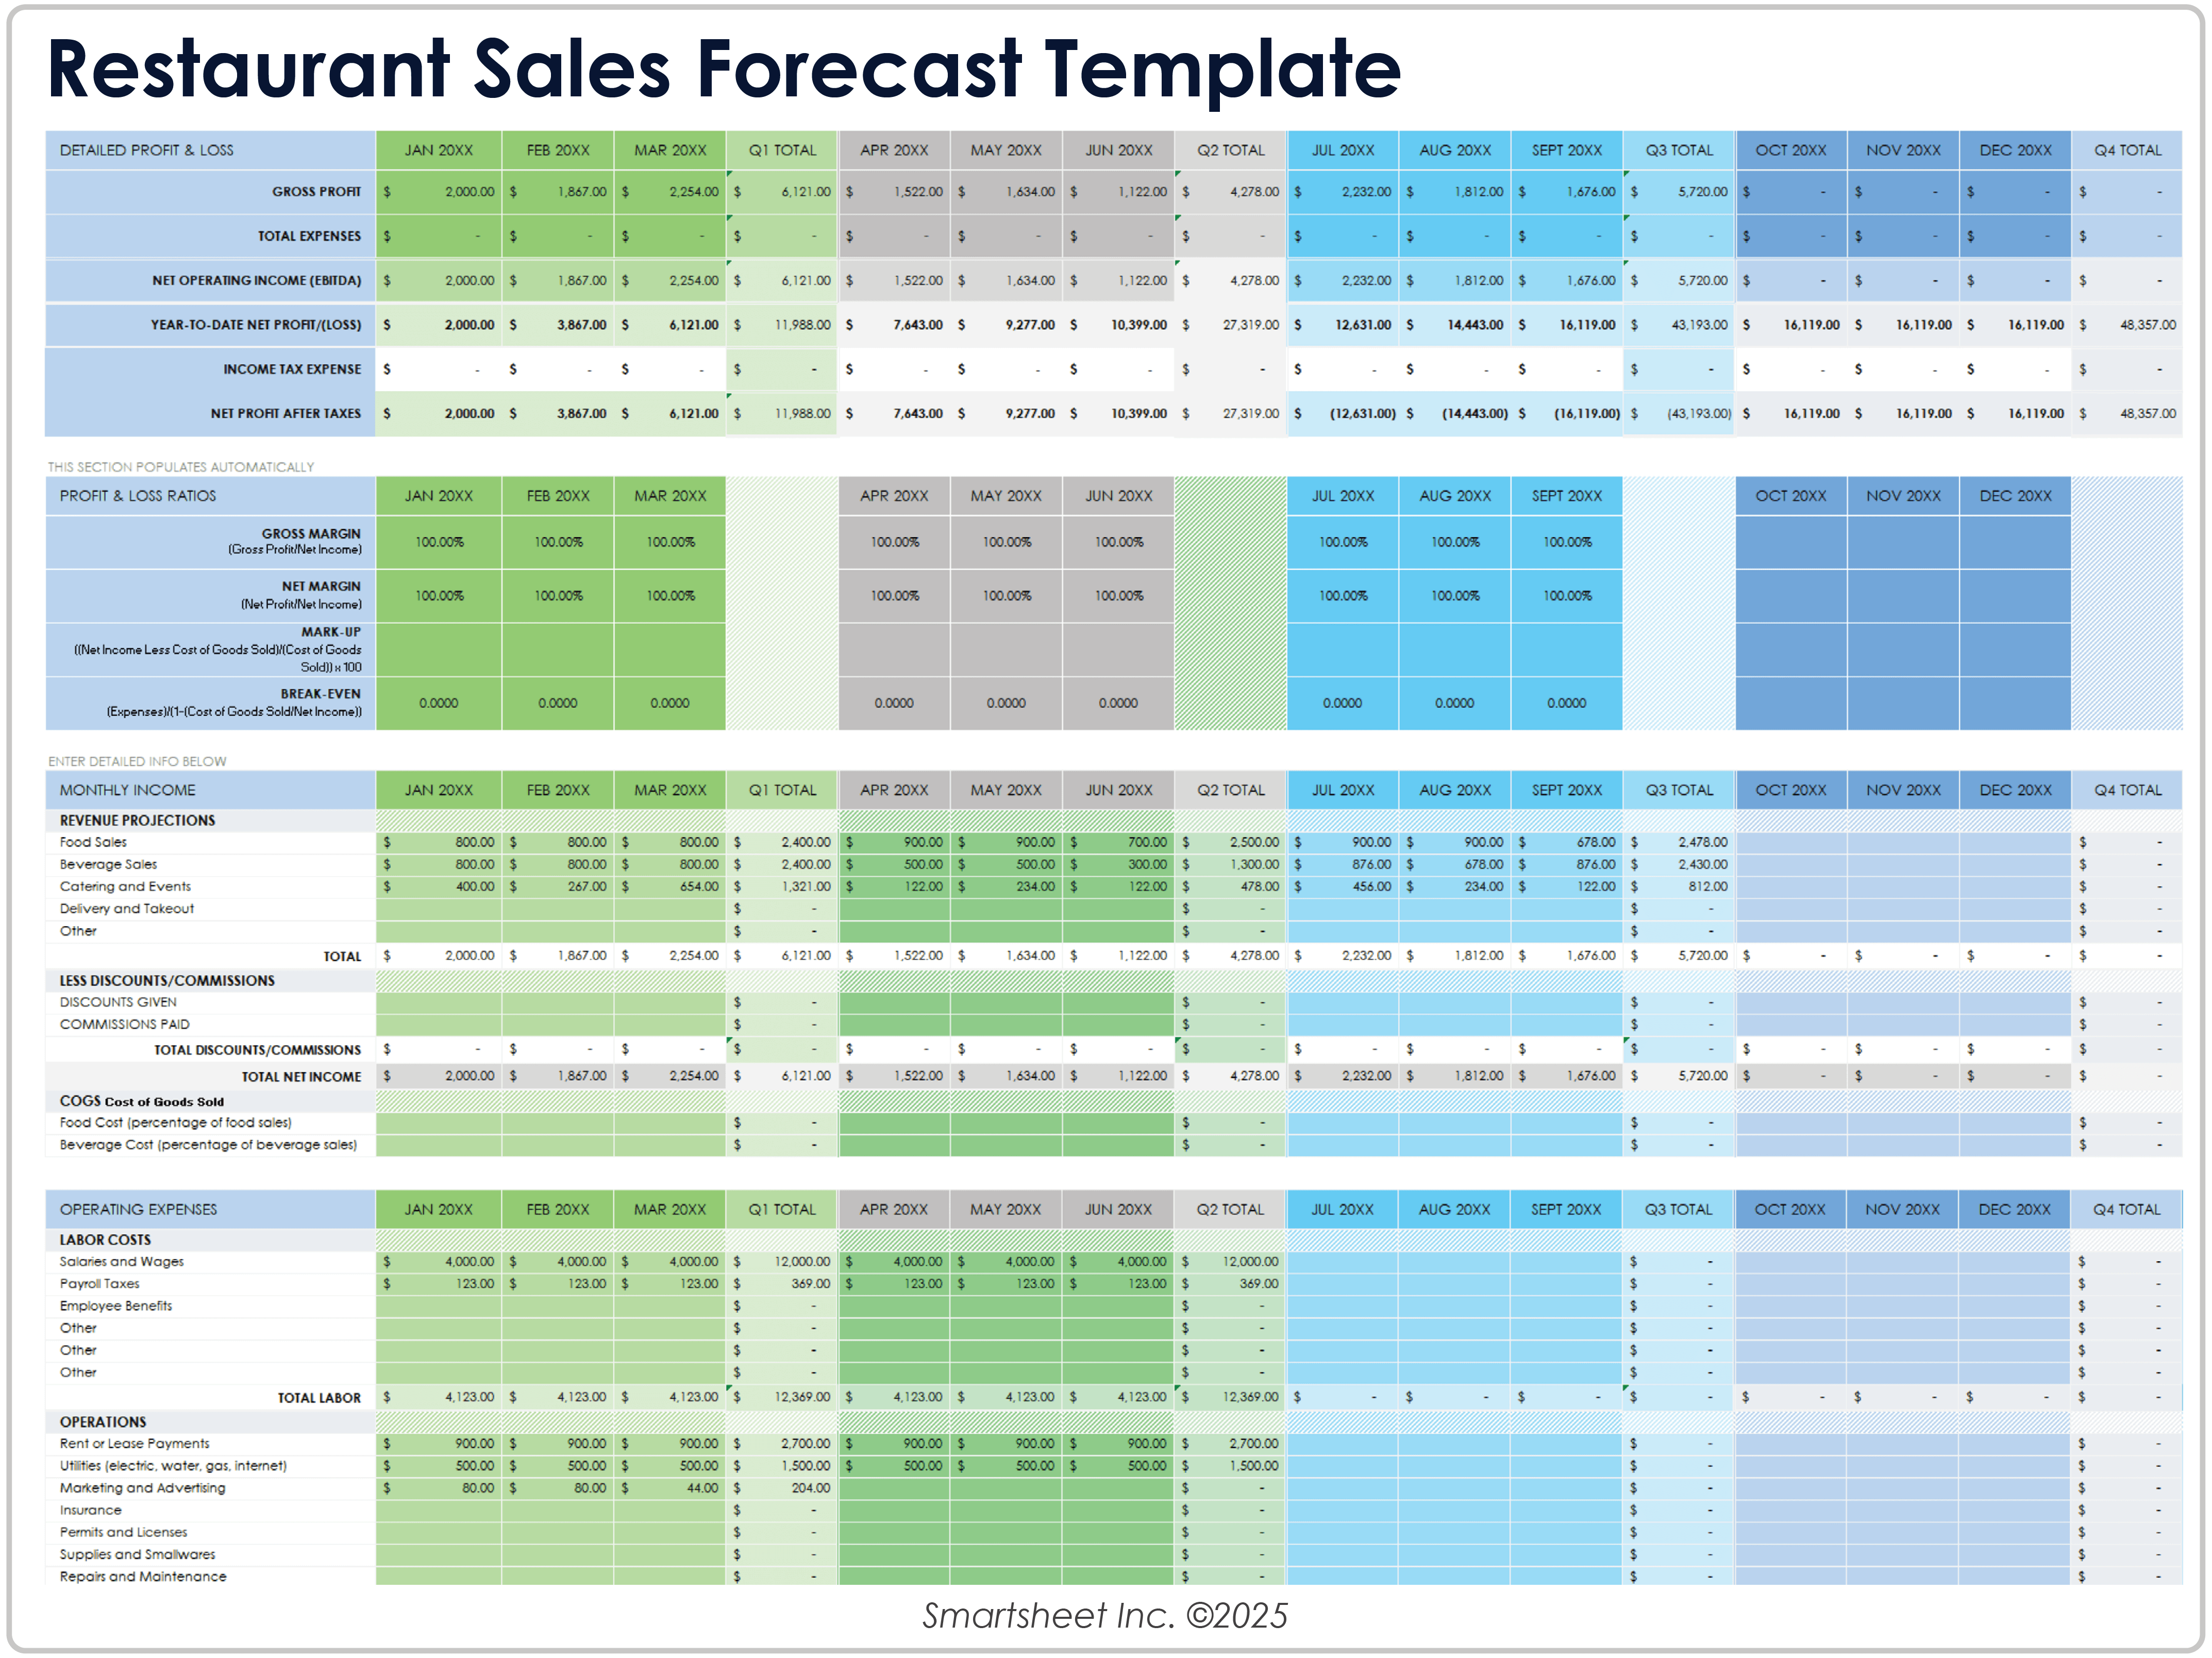
Restaurant Sales Forecast Template
Source: Smartsheet
