The most useful template is therefore the one that reduces formatting work without limiting thinking. A short management update may need only a title, executive summary, findings, recommendations, and an action plan. A detailed research report may require a methodology, literature review, data analysis, discussion, references, and appendices. Choosing the right starting point can make the entire writing process more efficient.
This guide explains how to evaluate report templates, what sections a professional report should contain, how Word, Google Docs, Excel, Google Sheets, PDF, and document formats differ, and how students and professionals can adapt a template to their own requirements. It also provides practical examples, research methods, data-analysis guidance, common mistakes, and a step-by-step workflow for producing a polished final document.
Most importantly, a template should never replace judgment. A well-designed document helps readers understand evidence, but the quality of the evidence, reasoning, interpretation, and recommendations still determines whether the report is useful. The best template is ultimately a framework that makes good information easier to communicate.

What Is a Business Report Template?
A business report template is a pre-structured document that provides a framework for presenting business information, research, analysis, conclusions, and recommendations. Instead of beginning with a blank page, the writer starts with predefined sections and formatting. The structure can then be adjusted to match the report objective, audience, organization, industry, or academic requirements.
Templates can range from simple one-page reporting forms to lengthy analytical documents. A monthly performance report may emphasize key performance indicators, charts, and short commentary, while a strategic report may contain environmental analysis, alternatives, risks, implementation considerations, and recommendations. A student business report can include academic references and analytical frameworks that would not necessarily appear in an internal management report.
The important distinction is between a template and a finished report. A template provides structure, not evidence. Placeholder headings such as “Introduction,” “Findings,” or “Recommendations” do not make a report complete. The writer must replace generic prompts with accurate information, relevant evidence, interpretation, and conclusions that directly address the report’s purpose.
A useful template also creates consistency. When an organization produces reports every month or quarter, a standardized layout can help readers locate familiar information quickly. Consistency can be especially valuable when different employees contribute reports or when managers compare reports across periods.
Professional templates commonly use heading styles, consistent spacing, tables, page numbering, headers and footers, and carefully controlled visual elements. These features are practical rather than merely aesthetic. A consistent hierarchy helps readers scan a long document and understand how individual sections relate to the report’s central message.

Why the Right Template Matters
A report can contain excellent research and still be difficult to use if the information is poorly organized. Readers should not have to search through several pages to discover the purpose, main findings, or recommended actions. A good structure makes the report’s argument visible and allows decision-makers to understand the important points without reading every sentence.
Templates also reduce repetitive formatting work. If a writer already has appropriate heading levels, page numbering, tables, and section placeholders, more time can be spent on research and analysis. This is particularly valuable when reports are produced frequently or when a deadline leaves little room for manual formatting.
Another benefit is quality control. A well-planned template can remind the writer to include sections that are easy to overlook, such as methodology, limitations, references, or appendices. It can also encourage consistent treatment of charts, tables, captions, and supporting evidence.
For teams, a common reporting framework improves comparability. Imagine three departments producing monthly performance reports using completely different structures. One may put revenue first, another may emphasize customer activity, and another may begin with operational problems. A standardized framework can make cross-department review considerably easier.
However, standardization should not become rigidity. A template should be changed when the report’s purpose requires it. A financial analysis, project status report, market research report, and strategic recommendation document do not necessarily need identical sections. Good reporting combines consistency with appropriate customization.
Core Sections of the Best Business Report Template
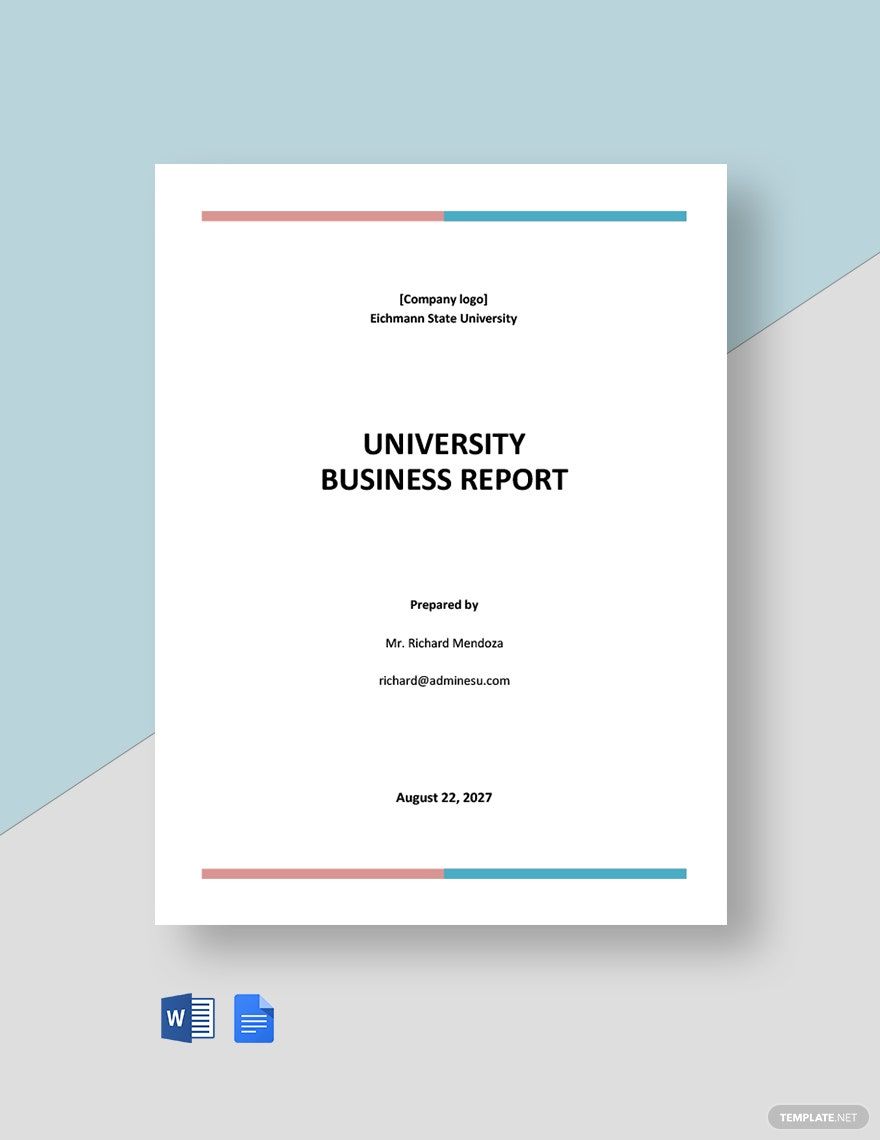
Although report structures vary, several components appear frequently in professional and academic business reporting. A title page identifies the document and its author or organization. An executive summary presents the purpose, important findings, conclusions, and recommendations. The introduction establishes context and explains what the report investigates.
The body contains the evidence and analysis. Depending on the assignment or business purpose, it may include background research, methodology, findings, discussion, financial analysis, market analysis, stakeholder analysis, risk assessment, or evaluation of alternatives. The body should be organized into meaningful sections rather than presented as one continuous block of text.
The conclusion brings the major findings together and explains what they mean. It should not introduce unrelated evidence. Recommendations then translate the conclusions into potential actions. Where appropriate, recommendations should identify priorities, responsible parties, timing, resources, risks, and expected outcomes.
References document the sources used to support the report. Appendices can contain material that is useful but too detailed for the main body, such as survey instruments, extended tables, calculations, raw data, interview questions, or supporting documents. Keeping supporting material separate can preserve readability without sacrificing transparency.
A template should make these sections easy to navigate. Clear heading levels are especially useful for longer reports because they help readers understand the hierarchy of information and can allow software such as Word or Google Docs to generate a table of contents automatically.

How to Build the Report Structure
The first step is to identify the decision or question the report must address. Before selecting fonts, colors, or page layouts, write a one-sentence statement describing the report’s purpose. For example: “This report evaluates three customer-service improvement options and recommends the option that offers the strongest balance of cost, feasibility, and customer impact.”
The second step is to identify the reader. A senior executive may need a concise overview and clearly prioritized recommendations. A technical manager may require more methodology and supporting data. A lecturer may expect theory, references, critical analysis, and a structure specified in the assignment brief.
The third step is to define the evidence required. If the report concerns customer satisfaction, the evidence may include survey responses, complaint data, interviews, and service metrics. If the report concerns financial performance, the evidence could include income statements, balance-sheet information, cash-flow data, ratios, and comparable periods.
The fourth step is to organize evidence into logical analytical categories. A report about a declining product might separate market conditions, customer behavior, pricing, competitors, distribution, operational constraints, and financial effects. The categories should help answer the central question rather than simply reflect the order in which information was discovered.
The fifth step is to choose headings that tell readers what they will learn. “Analysis” is acceptable, but a more descriptive heading such as “Customer Retention Analysis” provides stronger navigation. Good headings make a report easier to skim while reinforcing its analytical structure.

Executive Summary: The Most Important First Impression
The executive summary is often the most valuable part of a business report for a time-limited reader. It should allow someone to understand the report’s purpose, approach, major findings, and recommendations without having to read the entire document. Although it appears near the beginning, it is usually easier to write after the main report has been completed.
A useful executive summary answers four basic questions. Why was the report prepared? How was the issue investigated? What did the research or analysis find? What should happen next? These questions create a compact representation of the report’s decision logic.
The summary should prioritize meaningful findings instead of describing every section. If research identifies a major cost problem and a practical solution, those points should receive more attention than minor background details. A reader should finish the summary knowing what matters and why it matters.
Avoid turning the executive summary into an introduction that promises future analysis. Phrases such as “This report will discuss” are less useful than direct statements about what the report found. The summary should reflect completed work rather than merely previewing planned work.
For longer reports, concise paragraphs and selective bullet points can improve readability. However, the final design should remain professional and consistent with the rest of the document. The executive summary should feel like a high-value decision brief, not a collection of disconnected notes.
Writing the Introduction
The introduction establishes the context of the report. It should explain the situation, problem, opportunity, or question being investigated and make the report’s purpose clear. A strong introduction does not need to repeat the assignment question word for word; instead, it should translate the task into a clear business objective.
Scope is another important element. A report about declining sales could examine one product category, one geographic market, and one twelve-month period rather than attempting to analyze every factor affecting the company. Stating the boundaries helps readers understand what the report does and does not attempt to answer.
The introduction can also preview the analytical approach. For example, it may explain that the report uses customer survey results, sales records, competitor research, and interviews to evaluate potential causes of declining retention. This provides a bridge into the methodology or research section.
Background information should be selected carefully. The goal is not to provide everything known about the organization. Include only the context necessary for the reader to understand the issue, evidence, and decisions that follow.
A concise introduction often creates a stronger report than a long one. Readers should quickly understand the business situation, report purpose, scope, and overall direction. Once those elements are established, the body can concentrate on evidence and analysis.
Research and Data Collection
Good reporting begins with reliable information. Before collecting data, define what evidence is needed to answer the report question. This prevents the research process from becoming an unfocused search for interesting information that never contributes to the final recommendation.
Primary research can include interviews, questionnaires, observations, focus groups, experiments, or internal business records. Secondary research can include published studies, government information, industry reports, company filings, academic sources, and credible news or professional publications.
Each research method has strengths and limitations. Interviews can provide detailed explanations but may reflect individual perceptions. Surveys can gather responses from more people but may be affected by question wording or response bias. Internal performance data can show actual outcomes but may not explain why those outcomes occurred.
A useful methodology section explains what information was collected, how it was collected, and why the chosen method was appropriate. Where relevant, it should also identify the sample, timeframe, data sources, analytical method, and important limitations.
For example, a hypothetical customer-retention report might use an online questionnaire, interviews with service employees, twelve months of customer records, and competitor research. The report should clearly distinguish between those evidence types instead of presenting all information as though it has the same level of reliability.

Using Tables, Charts, and Visual Evidence
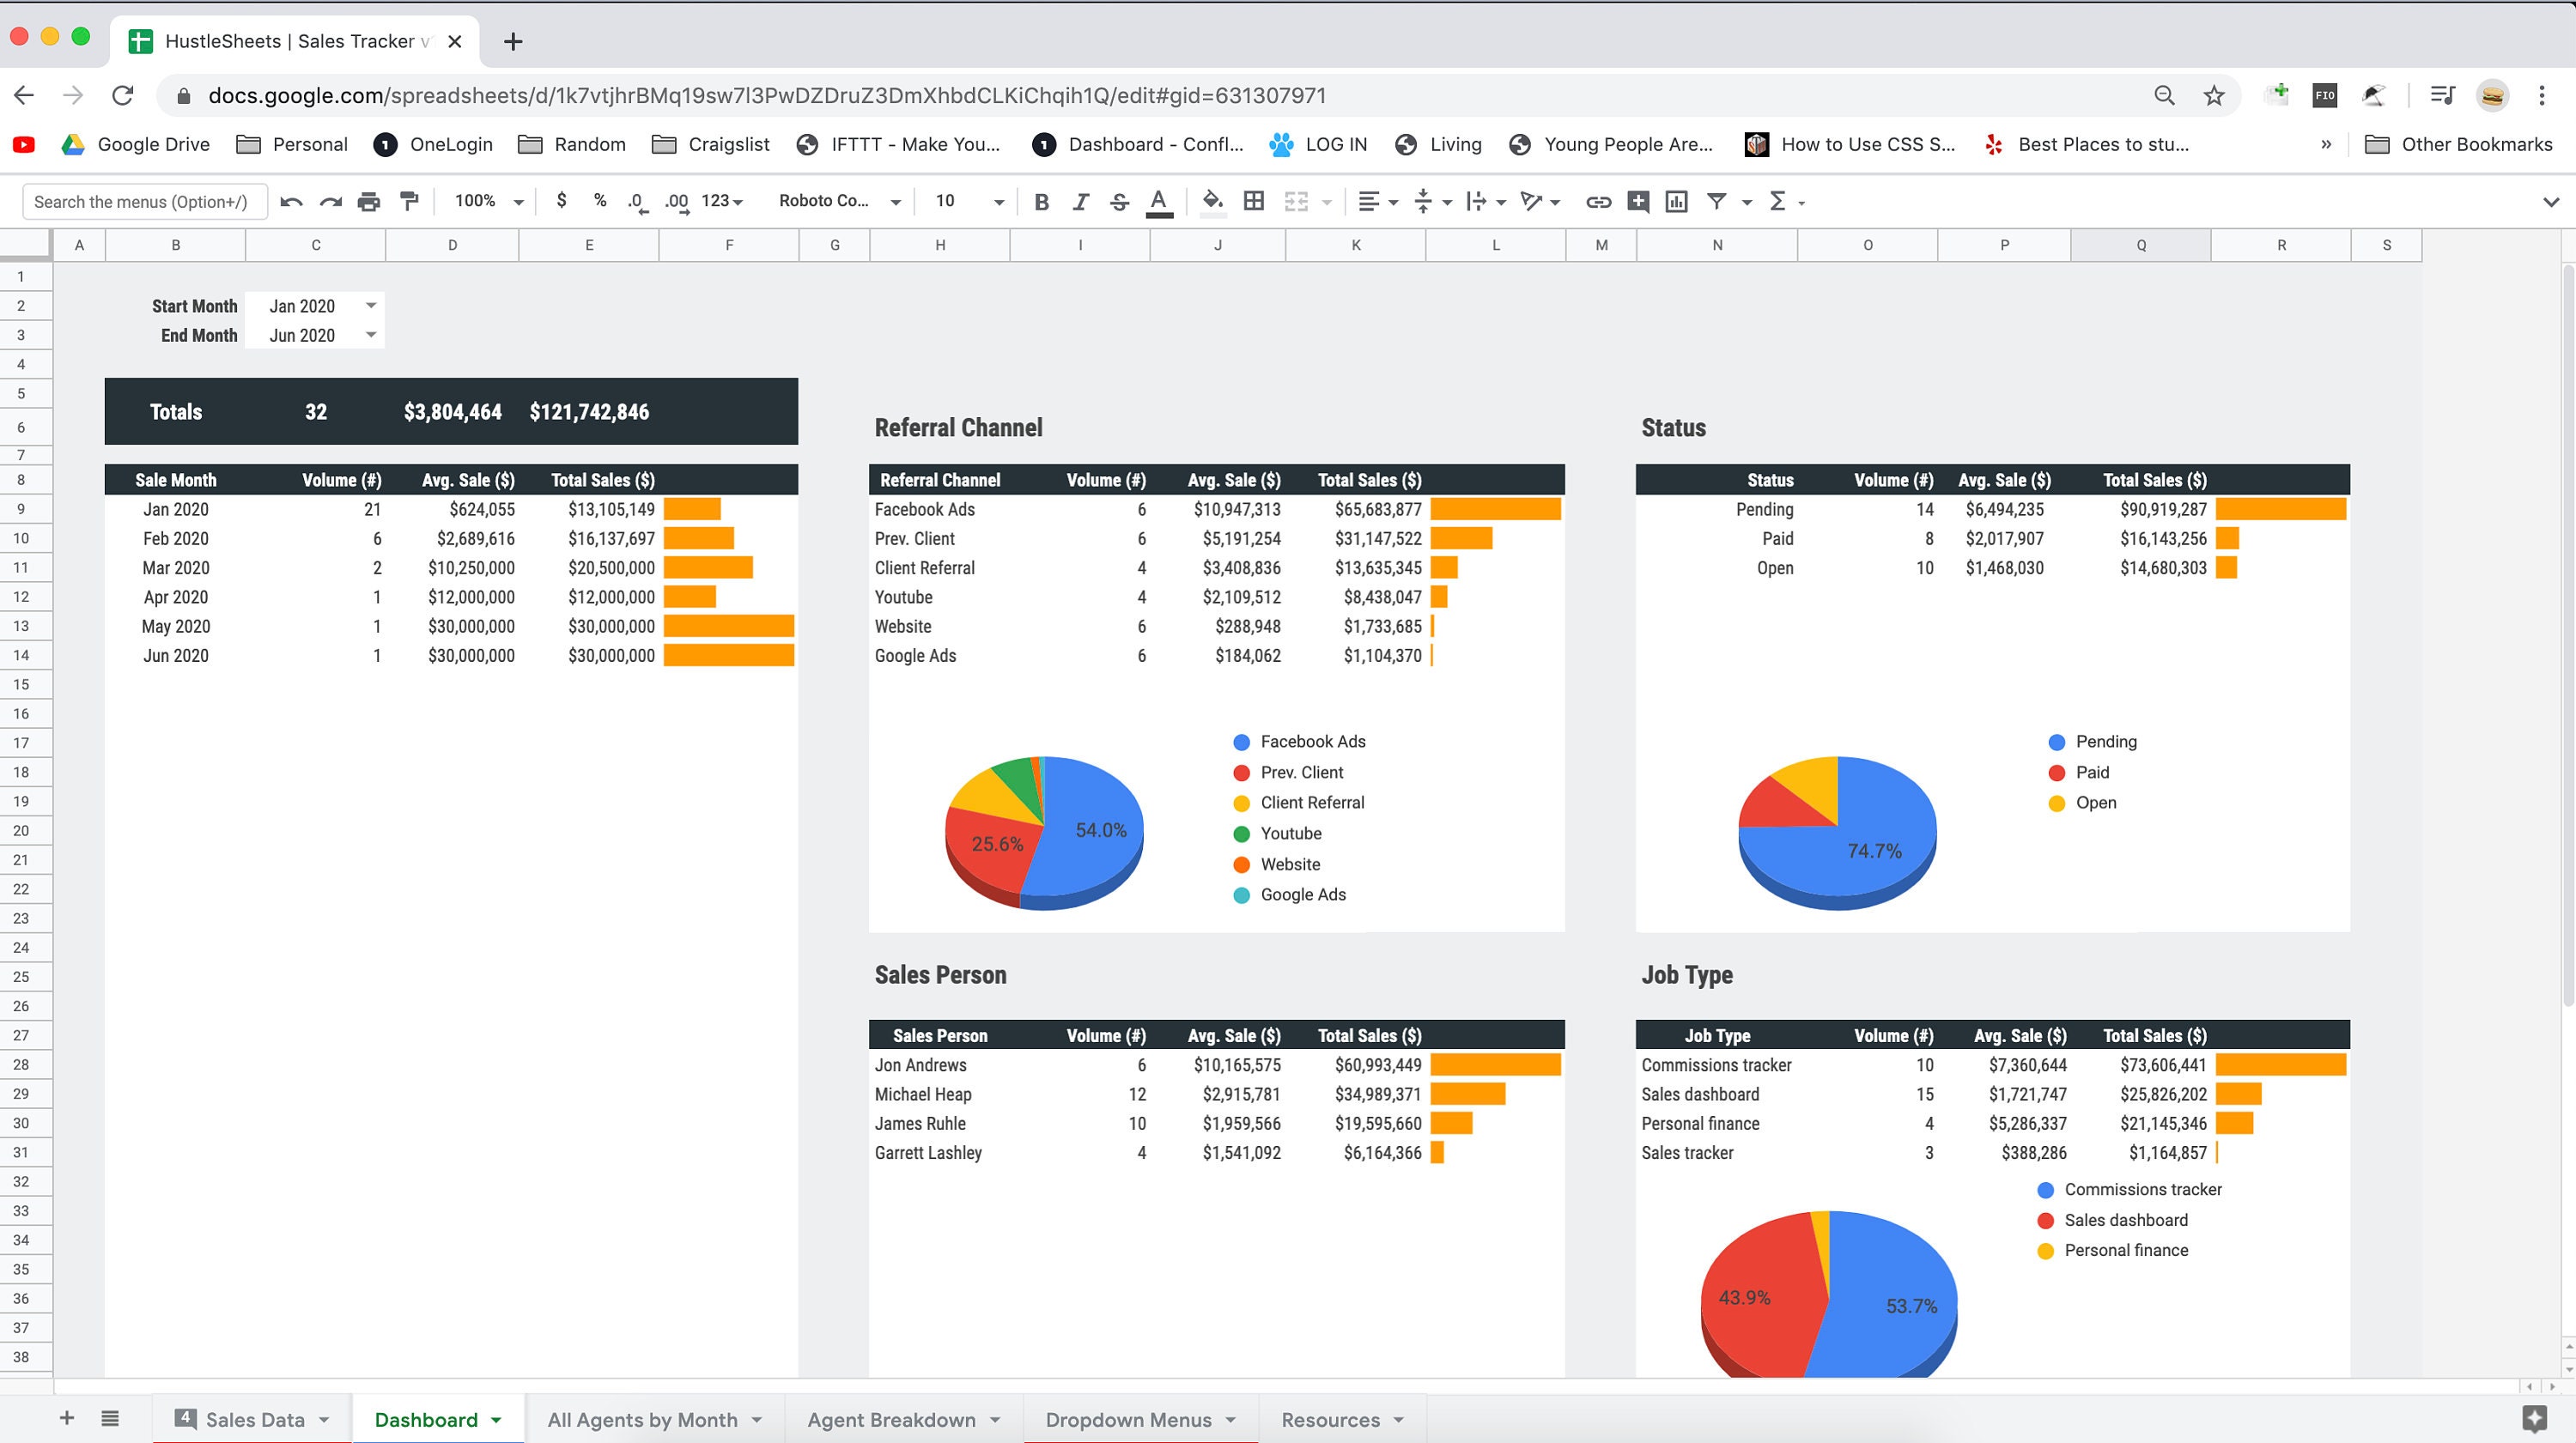
Charts and tables can make complex information easier to understand, but they should not be included simply because the template has space for them. Every visual should have a purpose. A chart may show a trend, compare categories, reveal a relationship, or communicate a distribution more efficiently than several paragraphs of prose.
Tables are useful when readers need exact values. For example, a table can show quarterly revenue, operating expenses, customer counts, and percentage changes. Charts are often better when the reader needs to see a pattern quickly, such as rising sales or a widening performance gap between business units.
Every visual should be clearly labeled and discussed in the surrounding text. A reader should not have to interpret a graph without explanation. The report should state what the visual demonstrates and, more importantly, why that pattern matters to the business question.
Chart selection should match the data. Line charts are useful for trends over time. Bar charts work well for comparing categories. Pie or doughnut charts can show simple composition when there are only a small number of meaningful categories. More specialized charts should be used when their analytical purpose is clear.
Visual consistency also matters. Use similar fonts, labels, number formats, and terminology throughout the report. Avoid excessive decoration, unnecessary three-dimensional effects, or crowded charts that make the underlying message harder to see.

Data Analysis and Interpretation
Data analysis is where a report moves beyond description. Reporting that sales increased from one quarter to another is descriptive. Explaining which product categories drove the increase, whether the change was seasonal, and what it means for the next quarter is analytical.
A useful analysis compares evidence against a meaningful reference point. Depending on the situation, that reference could be the previous period, budget, target, competitor, industry benchmark, customer segment, or strategic objective. Without a comparison, a number may have little meaning.
Suppose a hypothetical company reports a 12 percent increase in revenue. That sounds positive, but the interpretation changes if the company’s target was 20 percent, costs increased by 18 percent, or the increase came entirely from a low-margin product. The report therefore needs to consider relationships among measures rather than relying on isolated numbers.
Analysis should also distinguish correlation from causation. If customer complaints and employee turnover both increased during the same period, the report should not automatically claim that one caused the other. Additional evidence may be required to support a causal explanation.
Strong analysis connects evidence to the report objective. Each major finding should help answer the central question, explain an implication, or support a recommendation. If a piece of information does none of those things, it may not deserve a prominent place in the final report.

Financial Analysis in a Business Report
Financial information often plays a central role in business reporting because managers need to understand the relationship between operational performance and financial outcomes. Depending on the report objective, relevant measures can include revenue, gross margin, operating expenses, profitability, liquidity, leverage, cash flow, and return measures.
Financial ratios can be useful when they are interpreted rather than simply calculated. A ratio should normally be compared with previous periods, targets, competitors, or another appropriate benchmark. The report should explain what the movement means and what factors might have contributed to it.
For example, a hypothetical decline in gross margin could result from higher input costs, discounting, product mix changes, or pricing pressure. A good report would investigate plausible explanations rather than simply state that the margin decreased.
Financial tables should use consistent units, periods, and rounding. If one section reports amounts in thousands while another uses whole currency units without explanation, readers may misinterpret the information. Dates should also be unambiguous, especially when reports are shared internationally.
Financial analysis becomes most useful when connected to action. If a cost category is rising faster than revenue, the recommendation might involve supplier negotiations, process improvements, pricing changes, or a review of resource allocation. The appropriate action depends on the evidence, not on the template.

Choosing Between Word, Google Docs, Excel, and Google Sheets
Microsoft Word is particularly useful when the final deliverable is a formal narrative report. It supports heading styles, automatic tables of contents, page numbering, headers and footers, tables, references, comments, and document review. It is therefore a strong choice for reports where written analysis is the main component.
Google Docs is useful when several people need to collaborate on the same narrative document. Real-time editing and commenting can make it easier for a team to draft and review a report. It is especially convenient when contributors are working from different locations or devices.
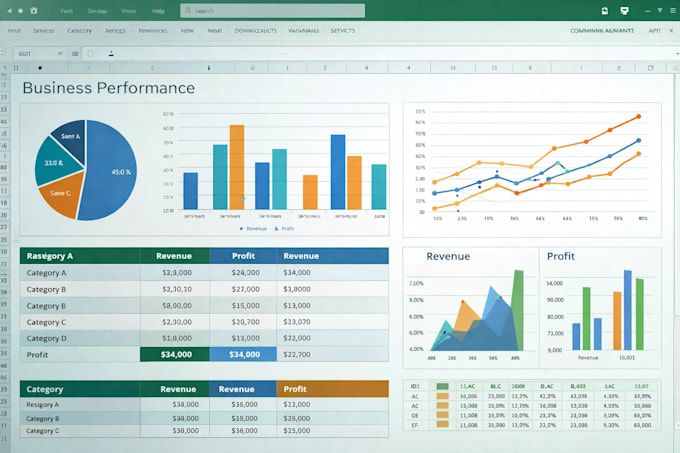
Excel is better suited to data-heavy reporting. A spreadsheet can store calculations, create pivot tables, produce charts, compare periods, and support dashboards. The final report may still be produced in Word or PDF, but Excel can provide the analytical engine behind the report.
Google Sheets offers similar advantages for collaborative numerical work. It is useful when teams need shared access to data, formulas, charts, and reporting tables. However, a spreadsheet should not automatically become the final presentation format if readers need a polished narrative explanation.
The best workflow may combine formats. For example, a team can collect and analyze data in Excel or Google Sheets, interpret the findings in a Word or Google Docs report, and distribute the final version as PDF. The important point is to choose each format for what it does well.

How to Make a Business Report Template Professional
Professional design starts with hierarchy. The report title should be clearly distinguishable from major headings, subheadings, body text, captions, and notes. Readers should be able to understand the document’s organization by scanning the page without needing to read every paragraph.
Typography should prioritize readability. A small set of complementary font sizes is generally more effective than using many decorative typefaces. Consistent spacing between headings and paragraphs also makes long documents easier to read.
Branding should be controlled rather than excessive. A company logo, restrained color palette, and consistent header can create a professional identity. However, visual branding should never interfere with charts, tables, or the readability of analytical content.
Page layouts should also consider printing and PDF conversion. Tables should not split awkwardly, headings should not be stranded at the bottom of pages, and important charts should remain large enough to read. A report that looks good on a large monitor may still need adjustment for paper or smaller screens.
Finally, use consistent terminology. If the report calls a customer group “enterprise clients” in one section, it should not switch to “corporate customers” elsewhere unless the terms have different meanings. Consistency reduces ambiguity and makes the document feel more carefully prepared.
Business Report Template for Students
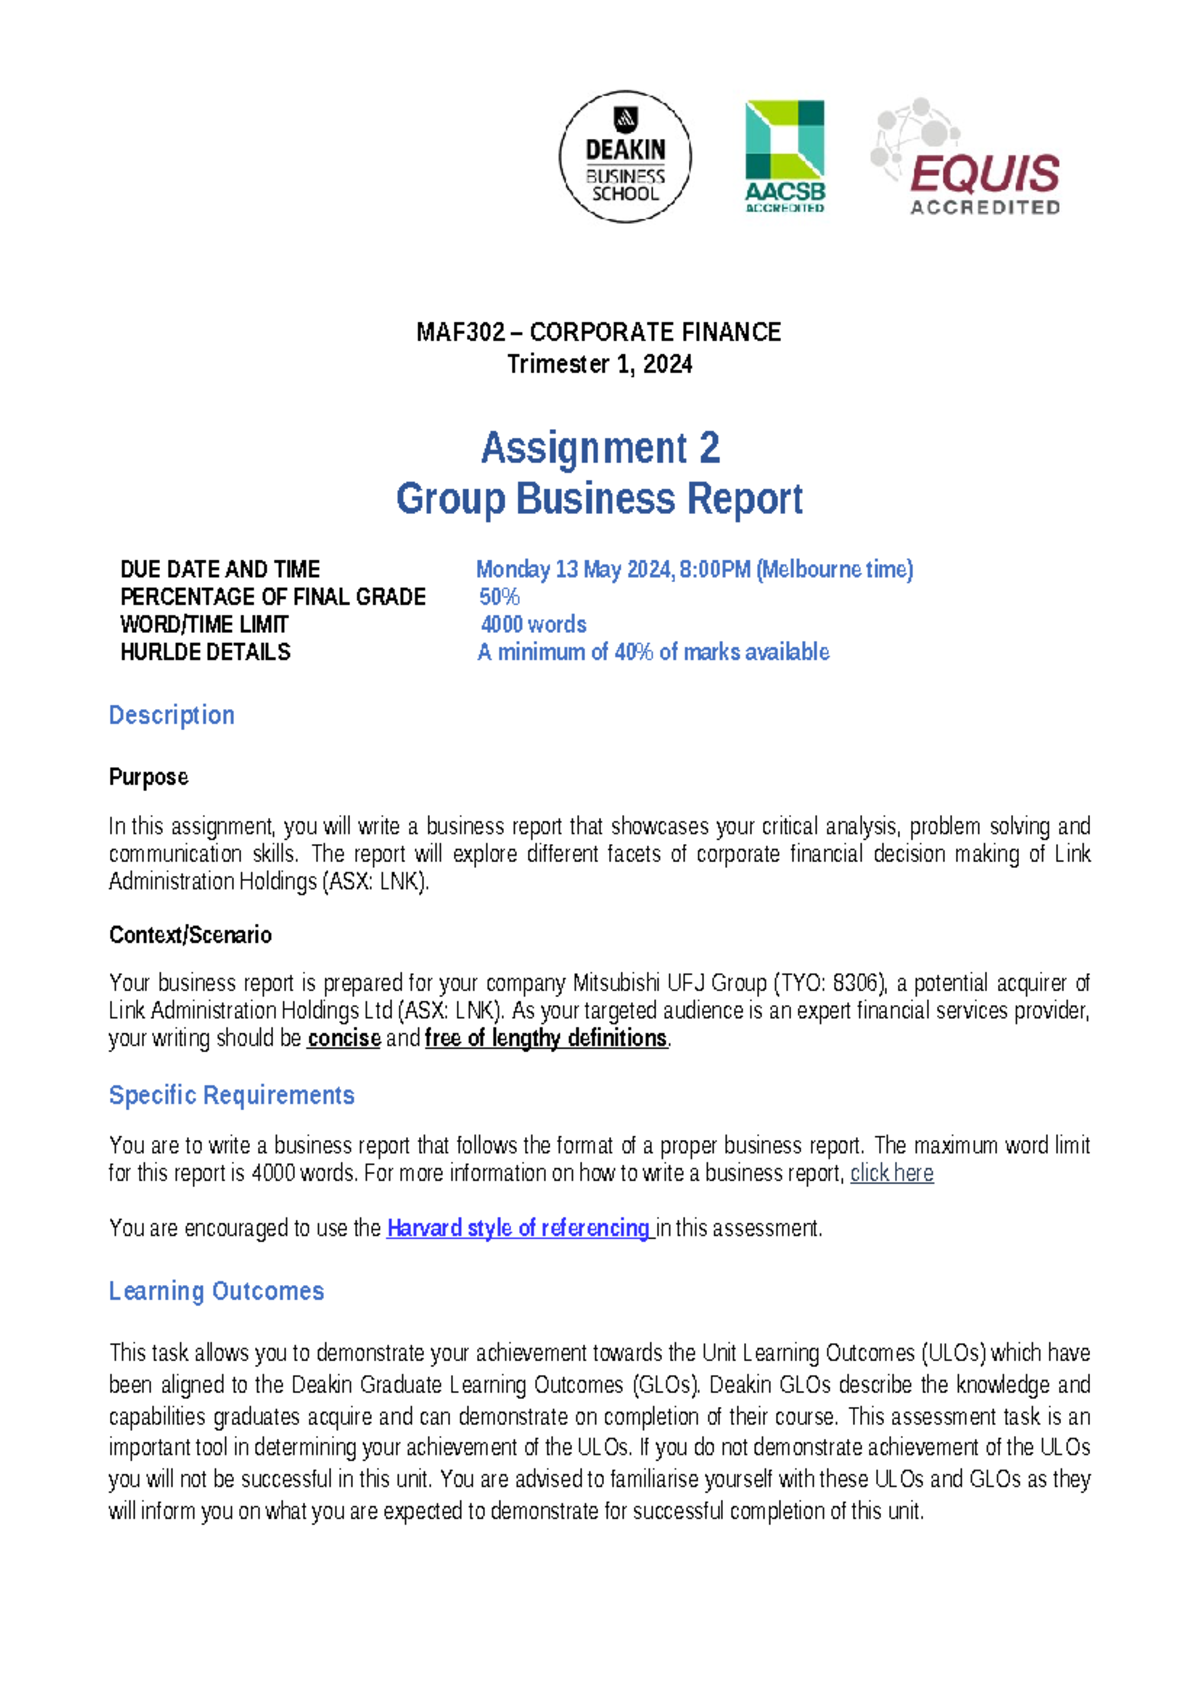
Students often need to balance academic requirements with professional business communication. A strong student report should follow the assignment instructions first, even when a downloaded template suggests a different structure. The lecturer’s rubric, word limit, required theory, referencing style, and specified headings take priority over any generic template.
A practical student structure might include a title page, executive summary, contents page, introduction, methodology, analysis or findings, discussion, conclusion, recommendations, references, and appendices. Not every assignment requires every section, so students should remove unnecessary components rather than filling them with weak content.
The analytical section is usually where a student demonstrates the ability to apply concepts rather than merely describe them. A report about a hypothetical company, for example, might apply SWOT analysis, financial ratios, stakeholder analysis, marketing theory, or another framework specified by the course.
Students should also distinguish between evidence and interpretation. A survey result is evidence. Explaining why the result matters to the business problem is analysis. A recommendation should then follow logically from that analysis.
Formatting should support the academic argument. Consistent headings, page numbers, tables, figures, citations, and references make the work easier to assess. A visually impressive cover cannot compensate for unsupported claims or weak analysis, so structure should always serve content.

Practical Example: A Market Analysis Report
Consider a hypothetical small retailer that has experienced weaker repeat purchases. The purpose of the report is to determine why customers are not returning and identify practical ways to improve retention. The report begins by defining the business problem and establishing the period being examined.
The research could combine customer survey responses, sales records, interviews with staff, website analytics, and competitor observations. Each source answers a different part of the question. Sales records reveal behavior, surveys reveal customer perceptions, interviews provide operational context, and competitor research provides external comparison.
The analysis might discover that first-time purchases remain stable while repeat purchases decline. A second finding might show that customers who experienced delayed delivery were less likely to return. These findings would be more useful than a general statement that “customer satisfaction is declining.”
The report could then evaluate several alternatives, such as improving delivery communication, changing the returns process, introducing a loyalty program, or revising post-purchase communication. Each alternative could be assessed against cost, feasibility, customer impact, operational requirements, and implementation risk.
The recommendation should follow from the comparison. If better delivery communication is inexpensive and directly addresses a documented problem, it may be recommended before a more expensive loyalty program. The example demonstrates why a report template is useful: it provides space for the evidence, comparison, reasoning, and action without deciding the conclusion in advance.

Practical Example: A Performance Report
A performance report may be prepared monthly or quarterly to show whether a team, department, product, or project is progressing toward defined targets. Unlike a long research report, this format often needs to be highly scannable because managers may review many performance reports at once.
A useful structure can begin with a short executive summary followed by a KPI table. Each KPI should show the current value, target, previous-period value, and variance where appropriate. The table provides a quick overview while later sections explain the most important movements.
Suppose a hypothetical sales team reaches 94 percent of its quarterly revenue target. That figure alone does not explain performance. A detailed report might show that two product categories exceeded target while a third category declined because of supply constraints.
The discussion should focus on meaningful exceptions. If most measures are close to target, spending several pages describing normal performance may add little value. More attention should be given to significant gaps, unexpected improvements, risks, and decisions required from management.
The report can finish with an action plan that assigns responsibility and timing. Instead of recommending “improve sales,” a stronger recommendation might specify that the sales manager should review underperforming product accounts, confirm supply availability, and report progress during the next performance cycle.

Practical Example: A Strategic Business Report
A strategic report usually requires more evaluation than a routine status report. The writer may need to examine the external environment, internal capabilities, customer needs, competitors, risks, financial implications, and possible strategic alternatives before recommending a direction.
A useful structure might begin with an executive summary and strategic context, followed by environmental analysis, current-state assessment, strategic options, evaluation criteria, recommended strategy, implementation considerations, risks, and conclusion.
Suppose a hypothetical company is considering entering a new market. The report could compare three entry options: direct investment, partnership, and online expansion. Each option could be assessed against investment requirements, speed, control, market knowledge, operational complexity, and risk.
The strongest recommendation would not simply identify the option that looks most attractive. It would explain why the option performs better against the chosen criteria and what conditions must be satisfied for it to succeed.
Strategic reporting also benefits from scenario thinking. A recommendation may work under one set of assumptions but fail if costs rise, demand is weaker than expected, or competitors respond aggressively. Including these considerations makes the report more useful for decision-makers.

Common Mistakes When Using a Report Template
One common mistake is treating the template as a checklist instead of a communication framework. Writers sometimes keep every section even when it does not support the report objective. This creates unnecessary length and weakens the main argument.
Another problem is leaving placeholder language in the final document. Phrases such as “insert findings here” or generic instructions can make an otherwise strong report appear unfinished. Every template field should be reviewed before the final version is delivered.
Overdesign is another frequent issue. Large decorative headings, excessive colors, oversized graphics, and unnecessary icons can compete with the actual analysis. Professional reporting generally benefits from visual restraint.
Writers can also misuse charts. A chart should communicate a specific message, not merely display available data. If a table is clearer than a chart, use the table. If the chart does not reveal a useful pattern, remove it.
Finally, avoid making recommendations that are disconnected from findings. Every significant recommendation should be traceable to evidence and analysis. If a reader asks, “Why are you recommending this?”, the report should provide a clear answer.

How to Create a Business Report From Scratch
Start by writing the report purpose in one sentence. Then identify the intended audience and the decision or action the report is expected to support. This prevents the document from becoming a collection of unrelated research.
Next, gather the evidence and organize it into categories. Keep notes about where each important fact came from so that references can be added accurately later. For numerical analysis, preserve the original data separately from calculations and presentation tables.
Create the headings before writing the full paragraphs. This allows you to test the logic of the report early. If the sections do not form a coherent path from problem to evidence to conclusion, rewriting the outline is easier than rewriting twenty pages of prose.
Draft the body sections before polishing the introduction and executive summary. This makes it easier to identify the actual key message. The executive summary should represent the finished report rather than an early assumption about what the report might find.
Finally, conduct separate content and formatting reviews. The content review checks evidence, logic, calculations, references, conclusions, and recommendations. The formatting review checks headings, page breaks, tables, figures, numbering, spelling, and consistency.

How to Review a Business Report Before Submission
Begin the review by asking whether the report actually answers the question it was commissioned to answer. A polished document can still fail if it focuses on interesting background information while neglecting the central business problem.
Next, examine the evidence behind every important claim. If the report says customers prefer one option, identify the evidence. If it says a strategy is financially attractive, check the calculations and assumptions. If it recommends an investment, verify that the supporting analysis is sufficient.
Review the relationship between findings and recommendations. Recommendations should not appear to have been selected before the analysis was conducted. Ideally, readers should be able to follow a visible chain from evidence to interpretation, conclusion, and action.
Then inspect the document visually. Check the table of contents, headings, page numbers, charts, tables, captions, references, and appendices. Open the final PDF if one is being distributed and inspect it independently because conversion can create unexpected page breaks or layout problems.
Finally, ask someone who was not involved in writing the report to read the executive summary and recommendations. If that reader cannot explain the main problem, major finding, and proposed action, the report may need clearer prioritization.

Best Practices for Reusable Business Report Templates
A reusable template should contain only stable elements. Company branding, heading styles, page numbering, standard sections, and formatting rules are often appropriate. Highly specific instructions or temporary examples should be removed before the template becomes a permanent organizational resource.
Use styles rather than manually formatting every heading. This makes the template easier to maintain and allows automatic navigation features to work correctly. A consistent style system also means future reports can be updated without redesigning every page.
Keep placeholders descriptive. Instead of inserting vague instructions such as “write something here,” a template can use prompts such as “Summarize the three most important findings and their business implications.” Useful prompts improve consistency without forcing identical wording in every report.
Include space for limitations where appropriate. Reporting is more credible when it explains important constraints in the evidence, such as a small survey sample, incomplete historical data, unavailable competitor information, or assumptions used in financial projections.
Review reusable templates periodically. Business processes change, reporting requirements evolve, and readers’ expectations can shift. A template that was efficient several years ago may contain unnecessary sections today or lack fields needed for current decision-making.

Practical Solution: A Step-by-Step Business Reporting Workflow
The most practical way to use the best business report template is to treat it as the final container for a reporting process rather than the starting point for random writing. Begin with the business question, define the audience, establish the decision required, and determine what evidence is necessary.
Once the objective is clear, select a template with the appropriate level of complexity. Use a concise format for routine updates and a more detailed structure for research, strategy, financial analysis, or major recommendations. Remove sections that do not serve the purpose of the report.
Collect and validate the evidence before making strong claims. Keep source information organized, check calculations, document assumptions, and distinguish facts from interpretation. If the evidence is incomplete, state the limitation instead of presenting an uncertain conclusion as definitive.
Write the analytical body around the report’s central message. Each section should have a reason for existing. Use tables and charts when they improve understanding, but explain their significance in the surrounding text. Avoid repeating the same finding in multiple formats unless repetition serves a clear communication purpose.
Finish with recommendations that are specific enough to act upon. Where possible, identify what should be done, who should own the action, what resources or conditions are required, how success will be measured, and when progress should be reviewed. This turns a report from a record of information into a practical decision tool.
Reference Examples
The following examples illustrate different visual approaches to business, academic, spreadsheet, and report documents. They are reference visuals rather than universal requirements; the appropriate format should always be determined by the report’s purpose, audience, organization, and applicable instructions.
best business report template google docs

Source: Highfile
best business report template free download
Source: Template.net
best business report template free
Source: Template.net
best business report template for students

Source: Template.net
best business report template excel
Source: Fiverr
best business report template word
Source: Template.net
best business report template google sheets

Source: Wikimedia Commons
best business report template pdf
Source: Template.net
best business report template uk
Source: Studocu
best business report template doc
Source: Template.net
best business report template download

Source: Template.net
best business report template australia
Source: Studocu
Frequently Asked Questions
What makes the best business report template?
The best business report template provides a logical structure without restricting the writer. It should make the purpose, executive summary, main analysis, conclusions, recommendations, references, and supporting information easy to organize and navigate. The ideal template is appropriate for the report’s audience and objective rather than simply being visually attractive.
How long should a business report be?
There is no universal length. A short operational report may be one or two pages, while a strategic or research report can be much longer. The appropriate length is the minimum needed to provide sufficient evidence, analysis, and recommendations without unnecessary repetition. Academic assignments should follow the stated word limit.
Should the executive summary be written first?
It appears first, but it is often easier to write it last. Once the research, findings, conclusions, and recommendations are complete, the writer knows exactly what the report’s most important messages are. The executive summary can then accurately reflect the finished document.
Can a business report template be used for academic assignments?
Yes, but it should be adapted to the assignment. Students should follow the lecturer’s required structure, referencing style, analytical framework, formatting rules, and word limit before relying on a generic template. A professional-looking template cannot override academic requirements.
Is Word better than Google Docs for business reports?
Neither is universally better. Word offers extensive document-formatting and review features, while Google Docs is particularly convenient for browser-based collaboration. The better choice depends on the team’s workflow, required features, document-sharing process, and final submission requirements.
Should Excel or Google Sheets be used for the final report?
They are excellent for calculations, data management, charts, dashboards, and quantitative analysis. A narrative report may be easier to read in Word, Google Docs, or PDF. A practical workflow often uses a spreadsheet for analysis and a document editor for interpretation and presentation.
What should be included in the recommendations section?
Recommendations should state practical actions that follow from the report’s findings. Strong recommendations can identify the proposed action, priority, responsible owner, timing, resources, risks, and measures of success. They should not introduce major conclusions that were never supported by the analysis.
How can I make a report template look professional?
Use a clear heading hierarchy, readable typography, consistent spacing, restrained branding, aligned tables, properly labeled charts, page numbers, and consistent terminology. Professional presentation is primarily about clarity and consistency rather than decorative design.
Conclusion
Choosing the best business report template means selecting a structure that helps readers understand the problem, evidence, analysis, conclusions, and recommended actions. The strongest template is not necessarily the most elaborate design; it is the one that supports the report’s purpose, fits the audience, handles the required evidence, and remains easy to navigate. Start with the business question, adapt the structure to the task, validate the evidence, explain what the data means, and make recommendations that can realistically be acted upon.
