The value of an operations analysis template is not limited to large organizations. A freelancer can use one to review client work, a service company can use one to analyze delivery processes, and a growing business can use one to compare departments, identify bottlenecks, and establish measurable priorities. The same basic framework can be adapted to Excel, Google Sheets, Google Docs, Word, PDF, or a dedicated business-management platform.
Modern business planning resources commonly separate strategic direction from operational execution, while operational planning focuses on how teams coordinate work, measure performance, review progress, and act on decisions. Microsoft, for example, describes business planning as a combination of business, market-analysis, financial, and execution-oriented planning activities. Other established template libraries provide business-plan formats in Excel, Word, PDF, Google Docs, and Google Sheets. These formats can be useful building blocks for an operations analysis system.
This guide explains what a digital operations analysis template should contain, how to build one, how to choose between spreadsheet and document formats, how to collect and analyze operational data, and how to turn findings into practical actions. It also explains how business-planning templates can support client planning, financial analysis, workflow reviews, and performance reporting without confusing a planning document with a complete operating system.
The goal is not to create the most complicated spreadsheet possible. The goal is to create a repeatable analysis process that makes important operational information easier to understand and easier to act on. A good template should reduce unnecessary work while improving the quality, consistency, and traceability of decisions.
What Is a Digital Operations Analysis Template?
A digital operations analysis template is a reusable digital document or spreadsheet designed to examine the activities, resources, systems, people, costs, outputs, and results that make up business operations. It provides predefined fields and categories so that the same type of information can be captured consistently over time.
Unlike a simple task list, an operations analysis template is intended to answer questions about performance and causes. A task list might tell a manager that an order is late. An operations analysis should help determine why it is late, where the delay occurred, how often the problem occurs, what it costs, who owns the relevant process, and what corrective action is appropriate.
The term “digital” is important because operational information increasingly comes from multiple digital sources. Sales platforms, accounting systems, customer-support software, project-management tools, inventory records, spreadsheets, surveys, and internal databases can all contribute information to an analysis. A useful template provides a common structure for turning these separate inputs into a coherent operational view.
A template also creates consistency. If one manager records process problems as narrative notes while another records them as metrics, comparisons become difficult. A structured template can establish common fields such as process owner, activity, expected time, actual time, cost, volume, error rate, customer impact, risk, priority, and recommended action.
The strongest templates are therefore less about appearance and more about disciplined thinking. A visually attractive dashboard that contains poorly defined metrics can be less useful than a simple spreadsheet with clear definitions, reliable source data, and accountable owners.
Why Operations Analysis Matters
Operations analysis connects business strategy with day-to-day execution. A company may have an excellent strategic plan but still struggle because its processes are slow, responsibilities are unclear, data is inconsistent, or resources are allocated inefficiently. Operational analysis makes those execution issues visible.
One of its biggest advantages is that it changes discussions from opinions to evidence. Employees may believe that a process is inefficient, while managers may believe the real issue is staffing. By recording cycle time, workload, error frequency, rework, cost, and customer impact, the organization can test competing explanations instead of relying entirely on assumptions.
Operations analysis also supports prioritization. Not every problem deserves immediate attention. A minor delay affecting a handful of internal tasks may be less important than a recurring defect that affects hundreds of customers. A template can help rank problems using impact, frequency, urgency, cost, risk, and strategic importance.
Another benefit is organizational memory. Operational problems are often rediscovered because previous analyses are stored in emails, personal files, or meeting notes. A central template creates a historical record of what was reviewed, what was discovered, which action was approved, and whether the action actually improved performance.
Finally, structured analysis makes recurring reviews easier. Instead of rebuilding an analysis from scratch every month or quarter, the organization can update the same framework with new data and compare current results with previous periods.
Core Components of a Digital Operations Analysis Template
1. Business Context
The first section should explain what is being analyzed and why. Include the business unit, process, reporting period, analysis owner, stakeholders, objective, and scope. Defining scope prevents the template from becoming a collection of unrelated observations.
For example, an operations review might focus only on customer onboarding. Its scope could include lead handoff, contract confirmation, account creation, welcome communication, setup, training, and the first customer-success review. Activities outside onboarding would be recorded only if they directly affect the selected process.
The context section should also identify the intended decision. If the analysis exists to reduce customer onboarding time, the template should not become dominated by unrelated financial metrics. Every major field should support the decision the analysis is intended to inform.
A clear objective might be “identify the three most significant causes of onboarding delay and recommend actions for the next quarter.” This is much more useful than a vague objective such as “review operations,” because it establishes the expected output.
The context should remain short enough that another person can understand the analysis within a few minutes. This is especially important when reports are shared with executives or stakeholders who were not involved in collecting the original data.
2. Process Inventory
A process inventory lists the operational activities that make up the selected business area. Typical fields include process name, process owner, department, trigger, input, major steps, output, supporting system, customer impact, and current status.
Process inventories are valuable because organizations frequently underestimate how many handoffs occur inside apparently simple workflows. A customer request might move through sales, finance, operations, support, and management before completion. Each handoff introduces potential waiting time or communication problems.
The inventory should distinguish between the formal process and the process that actually occurs. Written procedures sometimes describe an ideal workflow that employees cannot follow because of system limitations, missing information, approval delays, or exceptions.
Documenting the real workflow is therefore an essential part of analysis. Interviews, observation, system logs, transaction records, and employee feedback can be combined to establish how work actually moves.
A process inventory becomes even more useful when it is connected to performance data. Instead of merely listing “invoice approval,” for example, the analysis can record average approval time, number of approvals per transaction, rejection frequency, common rejection reasons, and the people or systems involved.
For operational analysis, spreadsheets are particularly useful when the process inventory needs sortable fields and consistent categories.

3. Performance Metrics and KPIs
A strong digital operations analysis template should define each important metric rather than simply listing abbreviations. A KPI is useful only when users understand exactly what it measures, how it is calculated, where the data comes from, and how often it should be reviewed.
Operational measures can include volume, cycle time, throughput, utilization, cost per transaction, defect rate, rework rate, backlog, service-level performance, response time, capacity, and customer-related measures. The appropriate metrics depend on the business process.
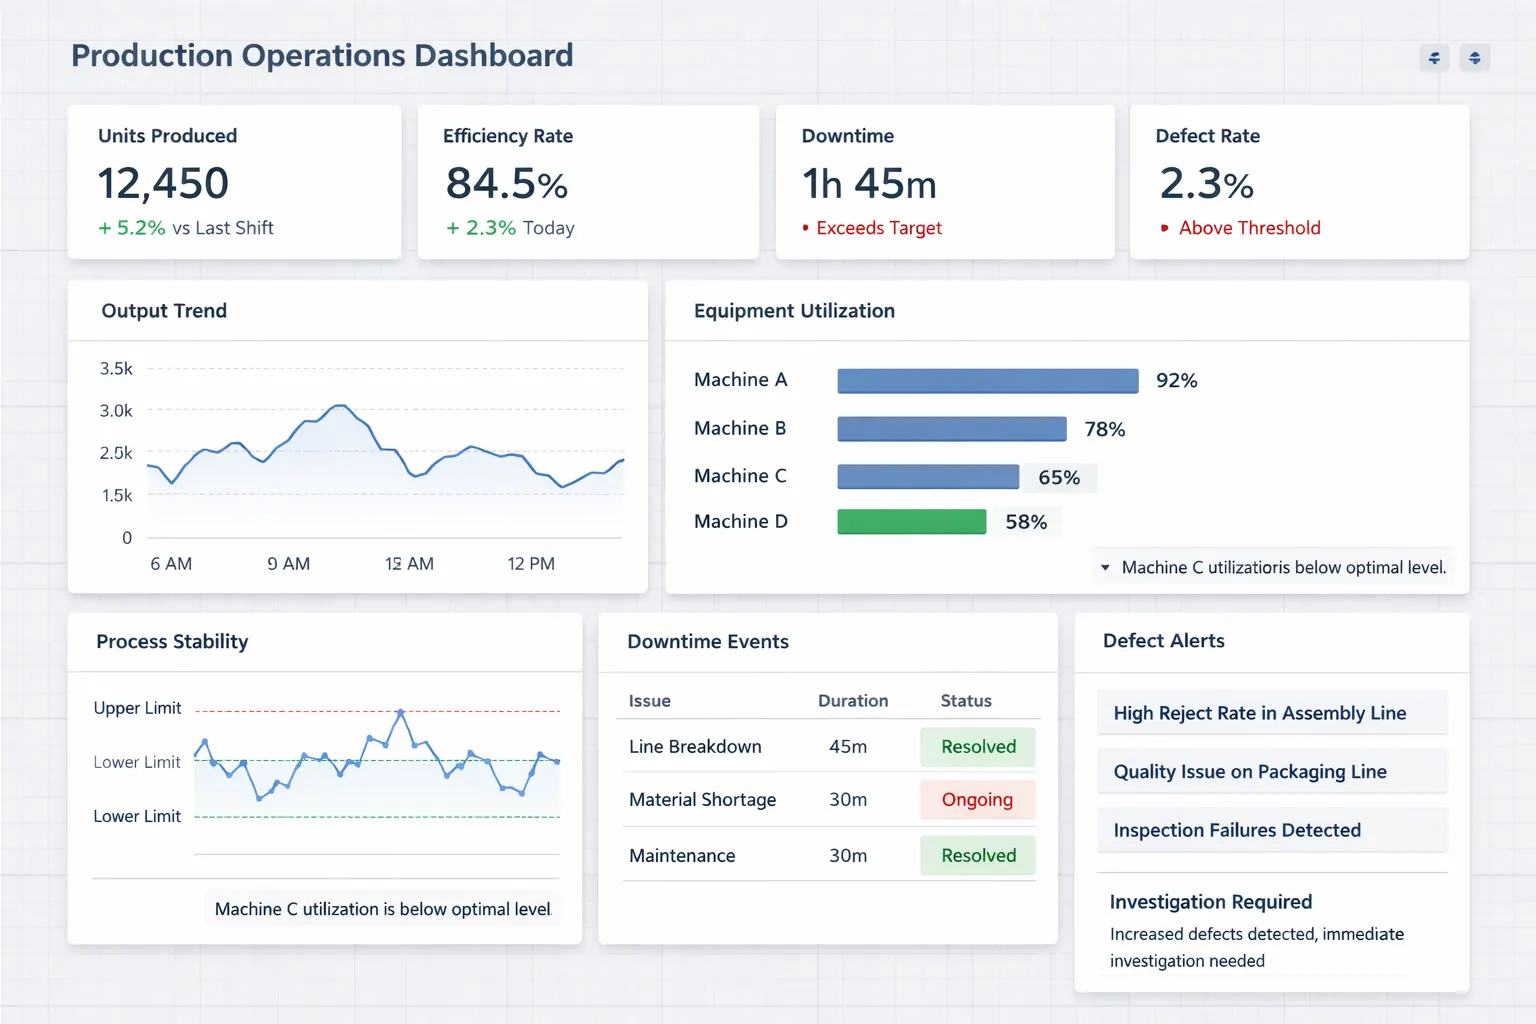
For example, a customer-support operation might monitor ticket volume, average response time, average resolution time, backlog, reopened cases, first-contact resolution, and customer satisfaction. A manufacturing process might instead focus on throughput, downtime, yield, defects, equipment utilization, and production variance.
Avoid creating a dashboard with dozens of metrics simply because the data is available. Too many indicators can hide the information that actually matters. A better approach is to identify a small group of decision-critical measures and then maintain supporting metrics in the underlying analysis.
Each KPI should also have an owner. Someone must be responsible for checking data quality, interpreting changes, and determining whether an action is required. Without ownership, a dashboard can become a passive reporting artifact rather than a management tool.
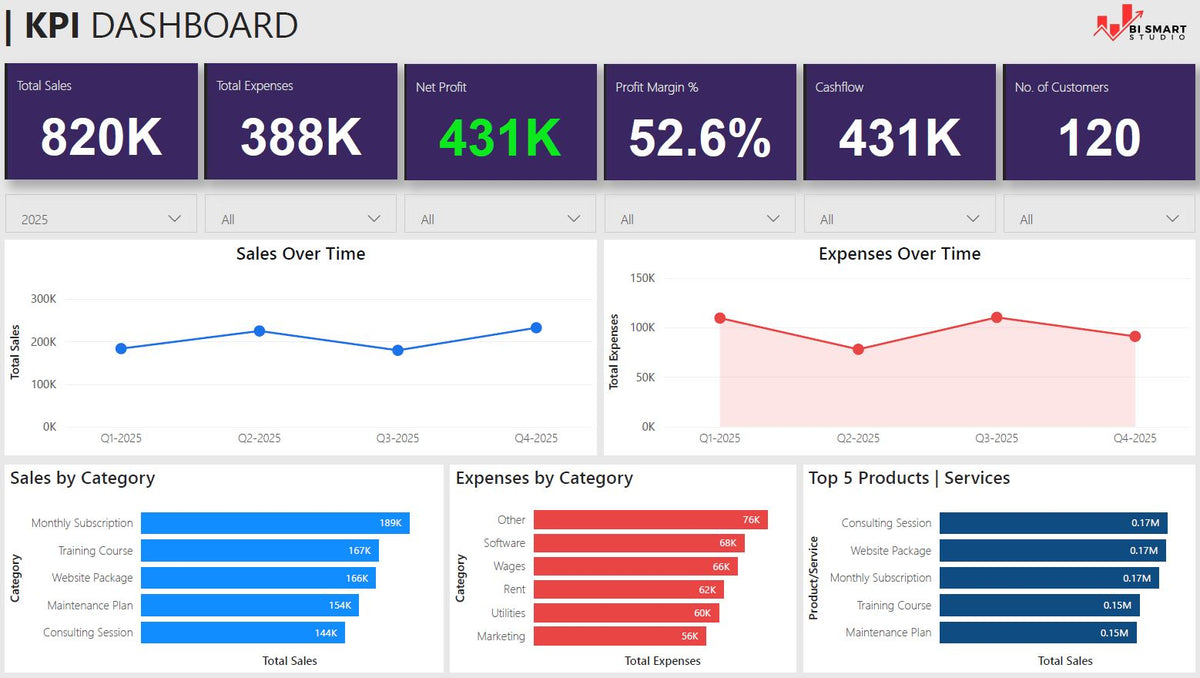
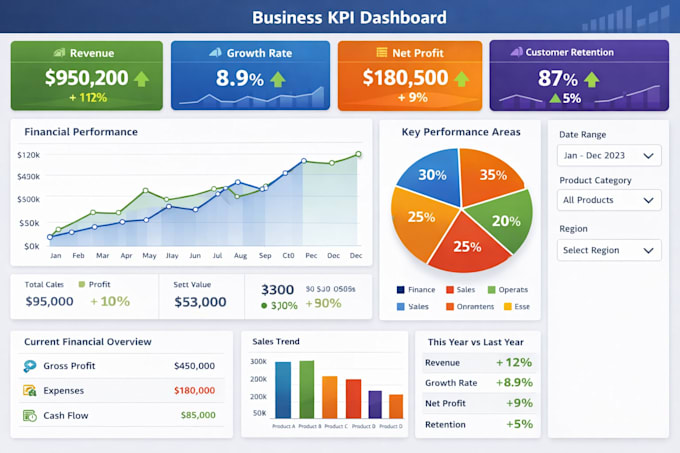
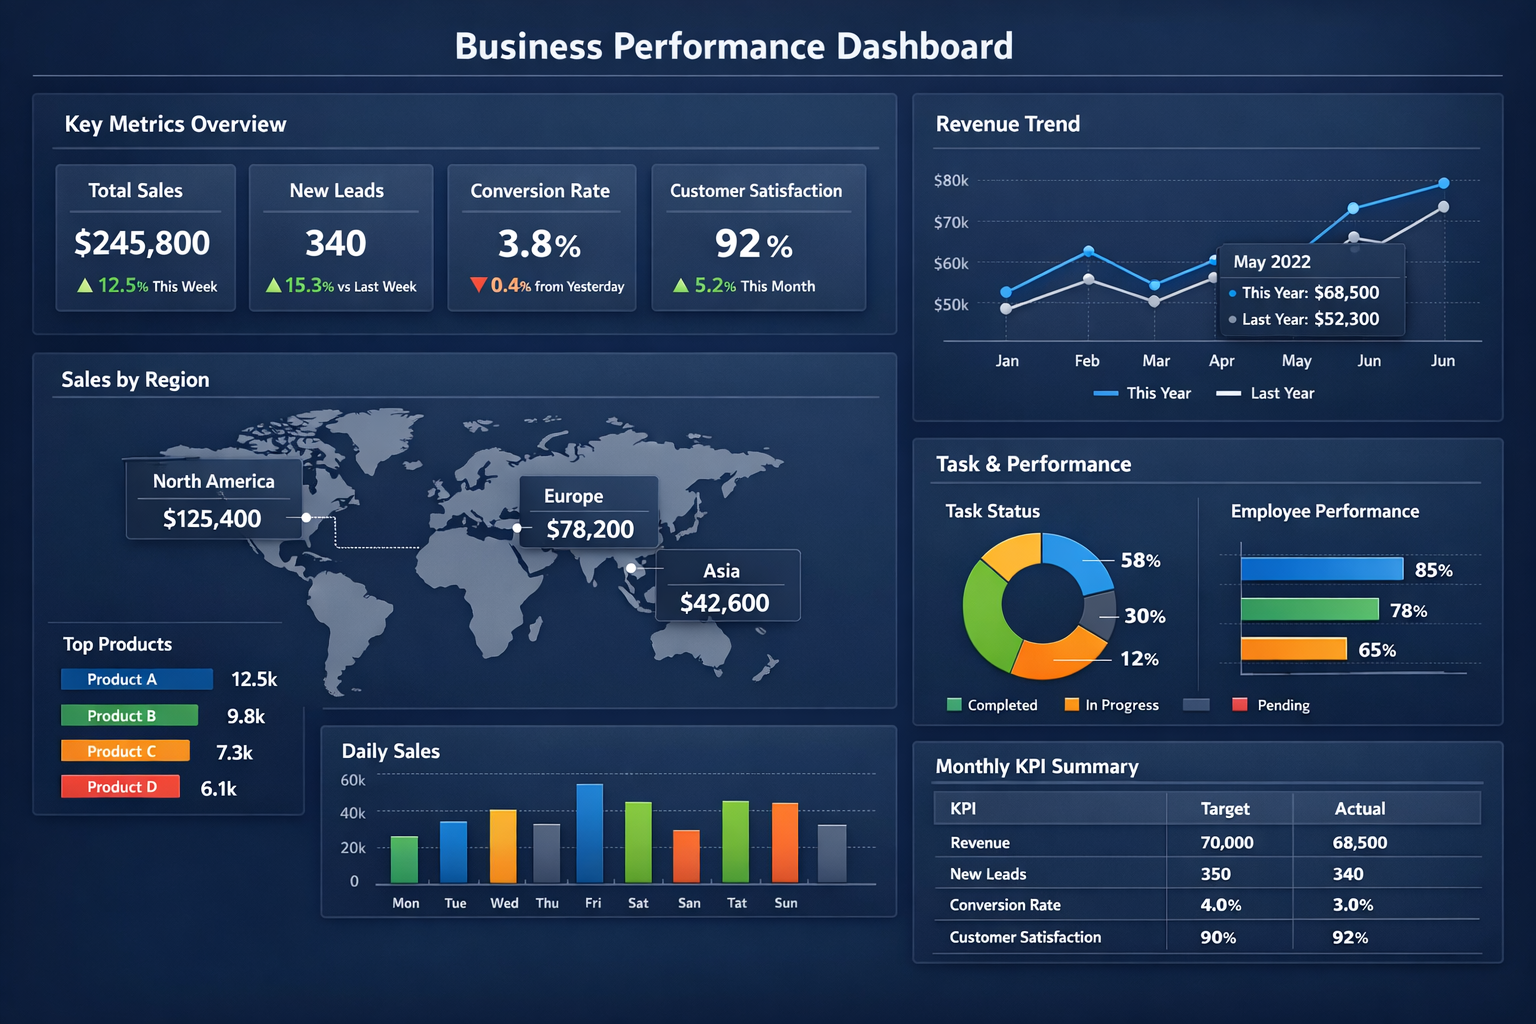
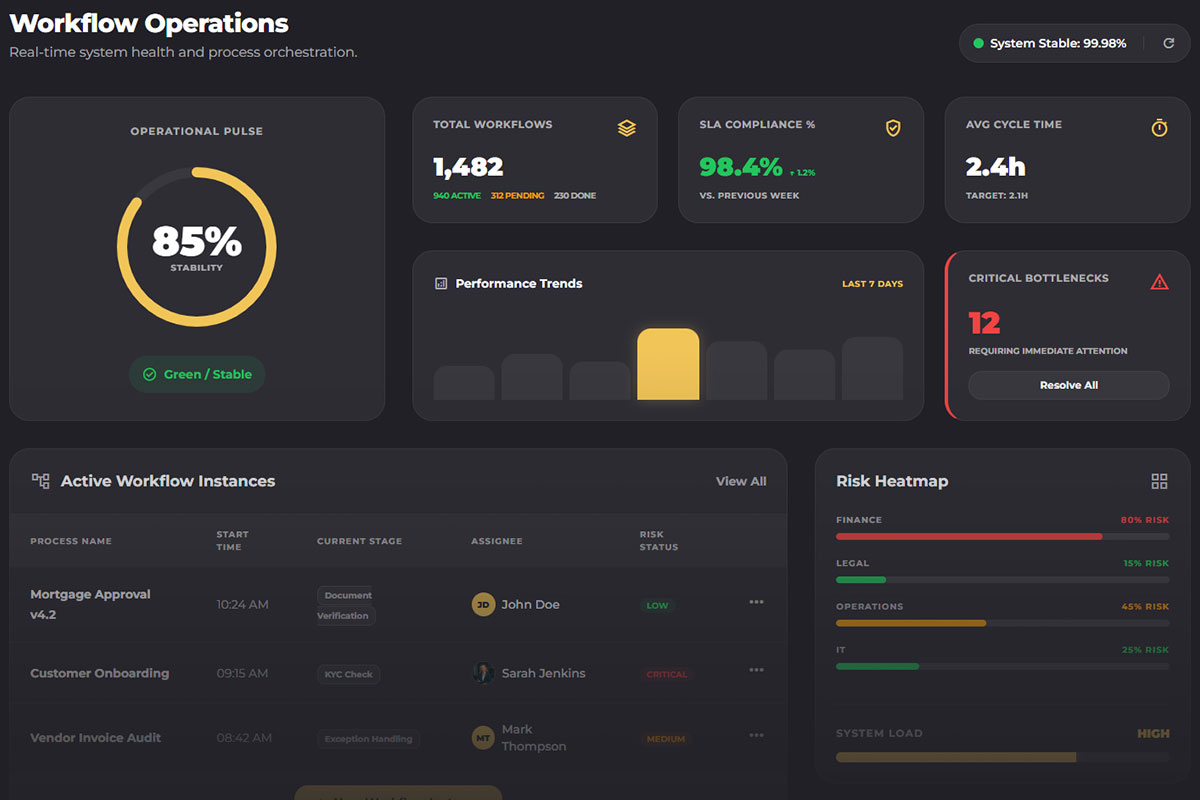
Operational dashboards often combine summary KPI cards with charts that reveal trends and comparisons. The important principle is that visualization should clarify the operational story rather than decorate it.

4. Data Sources and Data Quality
Every important operational metric should have an identifiable data source. This might be an accounting system, CRM, help-desk application, project-management platform, inventory system, spreadsheet, survey, transaction database, or manually collected operational log.
A template should include a data-source field so analysts can distinguish original information from calculated information. This improves traceability and makes future audits or updates easier.
Data quality should be reviewed before analysis begins. Common problems include duplicate records, missing dates, inconsistent categories, different units of measurement, outdated values, incorrect formulas, and records entered under different naming conventions.
Consider a simple example in which one department records customer complaints by product category while another records them by service type. Combining the two datasets without a mapping structure could create misleading totals. A data dictionary or standardized category list can reduce this risk.
The template should also record the analysis period. Operational results can change substantially depending on whether the dataset covers one week, one month, one quarter, or an entire year. Comparisons are meaningful only when the time periods and definitions are understood.
When data comes from manual entry, validation rules and controlled categories can reduce accidental inconsistencies. When data is imported automatically, the template should still contain checks for missing or unusual values.

5. Process Bottlenecks and Root Causes
Identifying a bottleneck is only the beginning. The analysis should distinguish the visible symptom from the underlying cause. A delayed order, for example, could result from poor inventory visibility, slow approval, inaccurate demand information, insufficient staffing, or an inefficient system integration.
Root-cause analysis can be supported by several methods. The five-whys approach encourages teams to repeatedly ask why a problem occurs. Fishbone analysis groups possible causes into categories such as people, process, technology, materials, measurement, and environment.
Process mapping is another useful technique. Mapping the sequence of activities, decisions, handoffs, and system interactions often reveals waiting periods that are invisible when the process is viewed only from the perspective of individual employees.
It is useful to record both evidence and interpretation. For example, “approval takes an average of three business days” is evidence. “Managers are too slow” is an interpretation that requires further investigation. Keeping these separate makes the final analysis more credible.
The template should allow multiple potential causes to be recorded because complex operational problems rarely have a single explanation. Each cause can then be evaluated according to evidence, frequency, impact, and controllability.
Once likely causes are identified, the analysis can connect each cause to a recommended intervention. This creates a clear line from observation to diagnosis to action.

6. Resource and Capacity Analysis
Operational performance is strongly influenced by available capacity. A process may appear inefficient when the real issue is that demand consistently exceeds the resources assigned to it.
Resource analysis can cover staff hours, equipment, facilities, software licenses, supplier capacity, inventory, budget, or management attention. The template should distinguish between theoretical capacity and practical capacity because not every available hour can be used productively.
For example, a support team with eight employees may have a nominal capacity based on their working hours, but meetings, training, breaks, administrative work, escalations, and leave reduce the time available for customer cases.
Capacity analysis is also useful for evaluating growth decisions. If transaction volume is expected to increase, management can estimate whether existing resources can absorb the additional workload or whether changes to staffing, technology, process design, or scheduling are needed.
The analysis should avoid assuming that adding resources automatically solves a problem. If a process contains unnecessary approvals or duplicated data entry, increasing headcount may increase cost without eliminating the underlying inefficiency.
For this reason, capacity analysis should be considered alongside process design, demand patterns, technology constraints, and productivity measures.

How to Build a Digital Operations Analysis Template
Step 1: Define the Decision the Analysis Must Support
Begin with the decision rather than the spreadsheet. Ask what management needs to decide after reviewing the analysis. The answer might involve reducing operating costs, improving service speed, deciding whether to automate a process, allocating staff, improving customer retention, or selecting a new operational priority.
Write the decision in one or two sentences. This becomes the filter for determining which data belongs in the template.
Next, define the scope. Specify the department, process, customer group, location, product, or time period being reviewed. A clearly bounded scope keeps the project manageable and prevents unrelated data from overwhelming the analysis.
Identify the stakeholders who will use the results. An operations manager may need detailed process data, while an executive may need only the most important trends, financial implications, risks, and recommended actions.
Finally, define the expected output. It could be a management report, operational dashboard, action plan, process-improvement proposal, or recurring review document.
Step 2: Design the Data Structure
Before adding colors or charts, determine the fields required. A practical structure might include process, activity, owner, volume, target, actual result, variance, root cause, impact, risk, recommendation, priority, due date, and status.
Use consistent data types. Dates should be dates, percentages should be percentages, monetary values should use a defined currency, and categorical fields should use controlled choices where possible.
Separate raw data from calculated information. A useful spreadsheet architecture may contain a raw-data sheet, a calculation sheet, a KPI summary, an action register, and a management dashboard.
Separating these layers makes the template easier to maintain. Users can replace raw data without accidentally overwriting formulas or presentation elements.
Where multiple people contribute data, define who owns each field and what constitutes a valid entry. This is particularly important when the template becomes part of a recurring reporting process.
Once the structure is established, a digital template can make the review process repeatable instead of rebuilding the analysis each time.

Step 3: Establish Baselines and Targets
Operational analysis becomes more meaningful when actual performance is compared with something. Depending on the situation, that comparison may be a target, historical baseline, service-level agreement, budget, forecast, benchmark, or previous period.
A baseline describes the starting condition. Without one, an organization may claim that a process improved simply because the current result looks acceptable. A baseline allows the organization to measure whether the change actually produced a meaningful difference.
Targets should be realistic and clearly defined. If a target is simply copied from another organization without considering differences in process design, customer expectations, resources, or technology, it may create misleading conclusions.
Variance is particularly useful for operational analysis. A template can calculate the difference between planned and actual cost, expected and actual cycle time, target and actual service level, or forecast and actual volume.
Trend information should also be retained. A single monthly result can be misleading if it represents an unusual event. Several periods of consistent data provide a stronger basis for identifying structural changes.
When targets are unavailable, historical performance can still provide useful context. The important point is to clearly state what the comparison represents rather than presenting every number as self-explanatory.
Step 4: Collect Qualitative and Quantitative Evidence
Numbers explain what is happening, but they do not always explain why. A strong operations analysis therefore combines quantitative evidence with qualitative information.
Quantitative evidence may come from transaction counts, timestamps, costs, sales records, inventory levels, service tickets, productivity reports, system logs, or survey responses.
Qualitative evidence may come from employee interviews, customer comments, observation, focus groups, process walkthroughs, stakeholder meetings, or open-ended survey responses.
The two forms of evidence should not be treated as competitors. They answer different questions. A system report might reveal that approval time has increased, while interviews could reveal that employees now need to enter the same information into two systems.
Qualitative findings should still be documented systematically. Record the source, date, theme, supporting evidence, and whether the observation has been confirmed through another source.
Combining the two evidence types produces a more complete operational picture and helps prevent managers from confusing isolated anecdotes with broad patterns.

Step 5: Analyze Variance, Trends, and Relationships
Once the data is organized, look for meaningful changes rather than simply describing every number. Compare actual performance with the baseline, target, previous period, and relevant operational volume.
Trend analysis can reveal whether a problem is temporary or persistent. For example, an increase in service complaints during one week may be associated with a specific event, while a steady increase over several months could indicate a structural issue.
Relationship analysis can also be useful. An analyst might compare staffing levels with response time, order volume with processing delays, or product volume with defect frequency. These relationships do not automatically prove causation, but they can identify areas that deserve investigation.
Segmenting the data often produces stronger insights. Instead of analyzing average response time across every customer, compare results by customer type, channel, product, region, process stage, or priority level.
Visualization should be selected based on the analytical question. A line chart is useful for trends, a bar chart for category comparisons, a scatter plot for relationships, and a table for detailed exceptions.
The purpose of the visualization is to make the decision easier. If a chart requires a long explanation before the audience can understand its meaning, the underlying design may need improvement.
Step 6: Convert Findings Into Actions
An operations analysis is incomplete if it ends with observations. Each important finding should be connected to a decision, recommendation, or request for further investigation.
A practical action register should include the problem, recommended action, owner, priority, expected benefit, required resources, deadline, status, and success measure.
Actions should be specific. “Improve onboarding” is too broad to manage effectively. “Remove duplicate customer-data entry from the onboarding workflow and test the revised process with the next 20 accounts” is more actionable because it defines the change and provides a basis for evaluation.
Where possible, define the expected result before implementation. If the goal is to reduce processing time, specify the desired direction and measurement method. This allows the team to evaluate whether the change produced the intended outcome.
Assigning owners is equally important. A recommendation without accountability can remain unresolved even when everyone agrees that it is necessary.
The action register should remain connected to the analysis so that future reviews can determine whether recommendations were completed and whether performance actually changed.

Choosing the Right Template Format
Excel
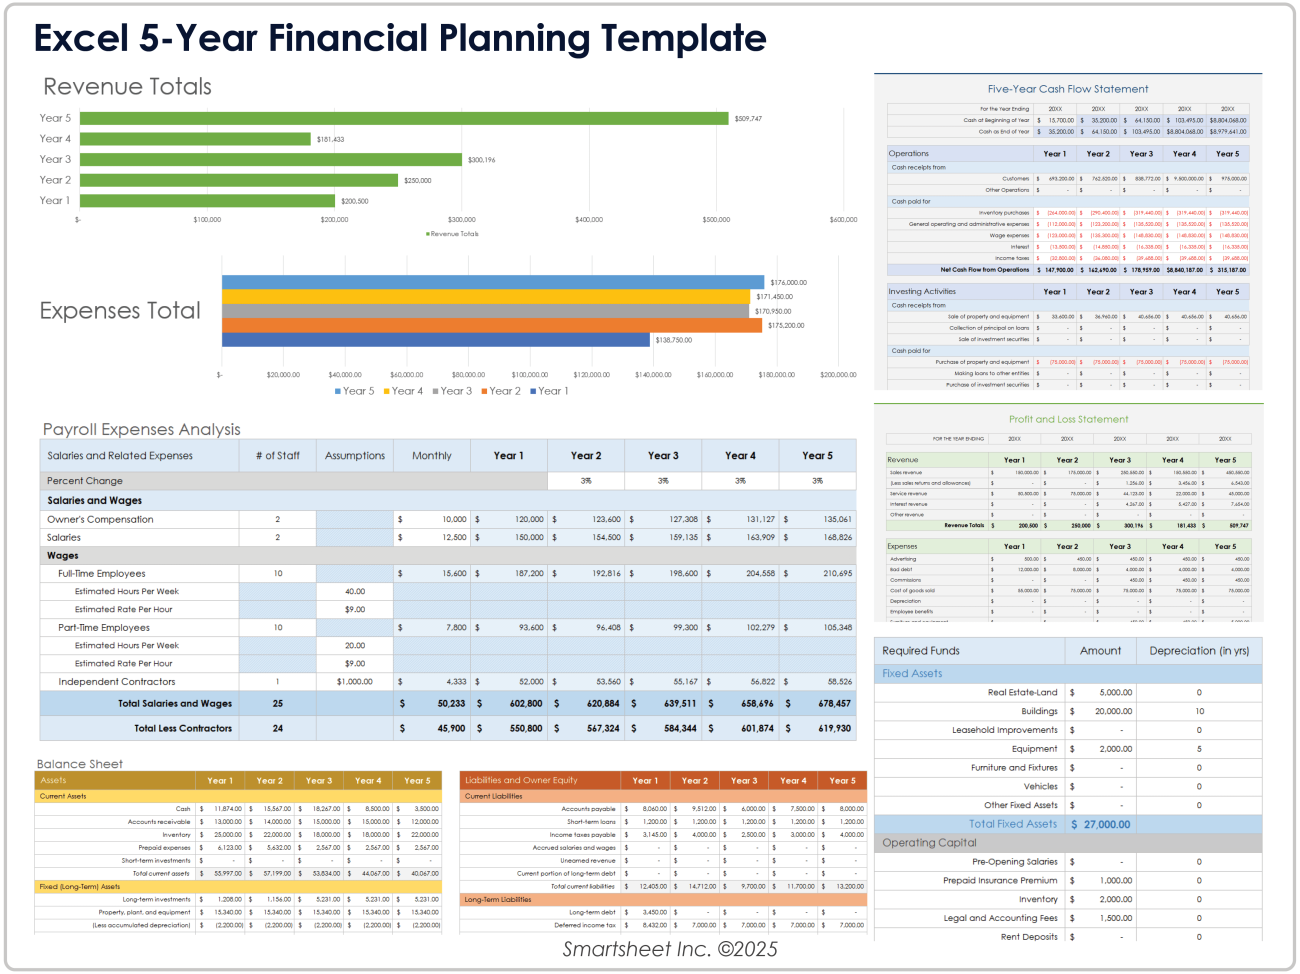
Excel is often appropriate when calculations, formulas, structured tables, pivot tables, scenario analysis, and offline editing are important. It is particularly useful for operational analysis that involves financial data, capacity calculations, variance analysis, or large structured datasets.
An Excel-based template can include separate sheets for raw data, calculations, KPI definitions, dashboards, action plans, and supporting assumptions. This structure gives users substantial control over how the analysis works.
The main risk is uncontrolled complexity. A spreadsheet can gradually accumulate formulas, manually edited values, hidden columns, and undocumented assumptions. A template should therefore use clear naming conventions, protected formula areas where appropriate, and documented calculation logic.
Google Sheets
Google Sheets is particularly useful when multiple people need to collaborate on the same operational analysis. Teams can work from a shared file, update records, review changes, and maintain a single online version rather than emailing spreadsheet copies back and forth.
Google Sheets is also useful for recurring operational reviews where information comes from several contributors. Controlled lists, protected ranges, formulas, charts, and shared access can create a practical lightweight reporting system.
However, collaboration does not automatically create good governance. Users should still establish ownership, permissions, data definitions, version practices, and review responsibilities.
A template designed for collaborative use should make it obvious which cells users are expected to edit and which cells contain calculations or reference information.
When an operational team needs shared planning and analysis without a complex implementation, a carefully structured Google Sheets workbook can be an effective starting point.
Google Docs and Word
Document-based formats are generally better when the primary output is a narrative report rather than a calculation-heavy analysis. They work well for executive summaries, process descriptions, findings, recommendations, meeting records, and formal operational reviews.
A document can provide context that a dashboard cannot. It can explain why a metric changed, describe stakeholder feedback, document assumptions, and present recommendations in a logical sequence.
Word can be useful when an organization needs offline editing, formal formatting, or document-control practices. Google Docs is often useful when teams need real-time collaboration and comments.
In practice, a spreadsheet and document often work best together. The spreadsheet stores structured data and calculations, while the document communicates the conclusions.
The important principle is to avoid copying data manually between systems whenever possible. If a report depends on a spreadsheet, establish a reliable process for refreshing figures before publication.
Choose the document format based on how the information will be used, not simply on personal preference.
PDF is generally best treated as a distribution or archival format rather than the primary working format for an operational analysis. It is useful when a finalized report must preserve its appearance across devices or be shared with stakeholders who should not edit the underlying analysis.
A PDF can contain an executive summary, charts, findings, action recommendations, and supporting tables. It can also provide a stable snapshot of what management reviewed at a particular point in time.
Because PDFs are not always convenient for updating calculations, organizations should normally retain the original editable spreadsheet or document alongside the exported PDF.
When a template is advertised as a PDF resource, verify whether it is actually fillable, editable, or simply intended for printing. These are different use cases.
For recurring operational reporting, maintain a controlled source document and export finalized versions to PDF when needed. This approach preserves both flexibility and recordkeeping.
The same principle applies to printed reports: printing should normally be the final presentation stage rather than the place where the analysis is created.
Business Client Planning and Operations Analysis
Client planning can be incorporated into an operations analysis when customers or business clients are central to the workflow. The objective is not merely to maintain a contact list. It is to understand client requirements, commitments, delivery status, risks, opportunities, communication patterns, and operational dependencies.
A client-planning section might include client name, segment, account owner, service scope, active projects, next milestone, outstanding issue, priority, renewal date, communication status, and operational risk.
For professional-services firms, consultants, agencies, and B2B providers, this information can connect customer activity with internal workload. If several high-priority clients require work during the same period, the operational analysis can reveal capacity pressure before deadlines are missed.
Client planning can also support service reviews. Managers can compare promised service levels with actual delivery performance and identify recurring causes of dissatisfaction.
It is important to separate client information from unnecessary personal data. A business planning template should collect only information that is relevant to the operational purpose and should follow the organization’s privacy, access, and retention practices.
When client planning is integrated with operational analysis, the result can become a bridge between customer management and internal execution.
Practical Example: Service Business Operations Analysis
Consider a hypothetical consulting company that has noticed increasing delays in delivering client projects. The company decides to analyze its project-delivery operation using a digital operations analysis template.
The first section records the scope: projects completed during the previous quarter. The business defines the objective as identifying the main causes of delivery delay and determining which operational changes should be implemented during the next quarter.
The process inventory identifies sales handoff, project kickoff, requirements gathering, production, internal review, client review, revisions, final approval, and delivery. Each stage receives an owner and a target duration.
The data section records actual completion dates, number of revision cycles, hours used, client response time, internal review time, and final delivery date. The company then calculates the variance between planned and actual project duration.
The analysis discovers that the largest delays occur after client review. Further investigation shows that requirements are sometimes incomplete at project kickoff, causing clients to request substantial changes later.
The company could then recommend a standardized requirements-confirmation step before production begins. The action register would assign ownership to the project manager, define the new checkpoint, and establish a future measure such as the average number of major revision cycles.
Using a Template for Financial and Operational Analysis
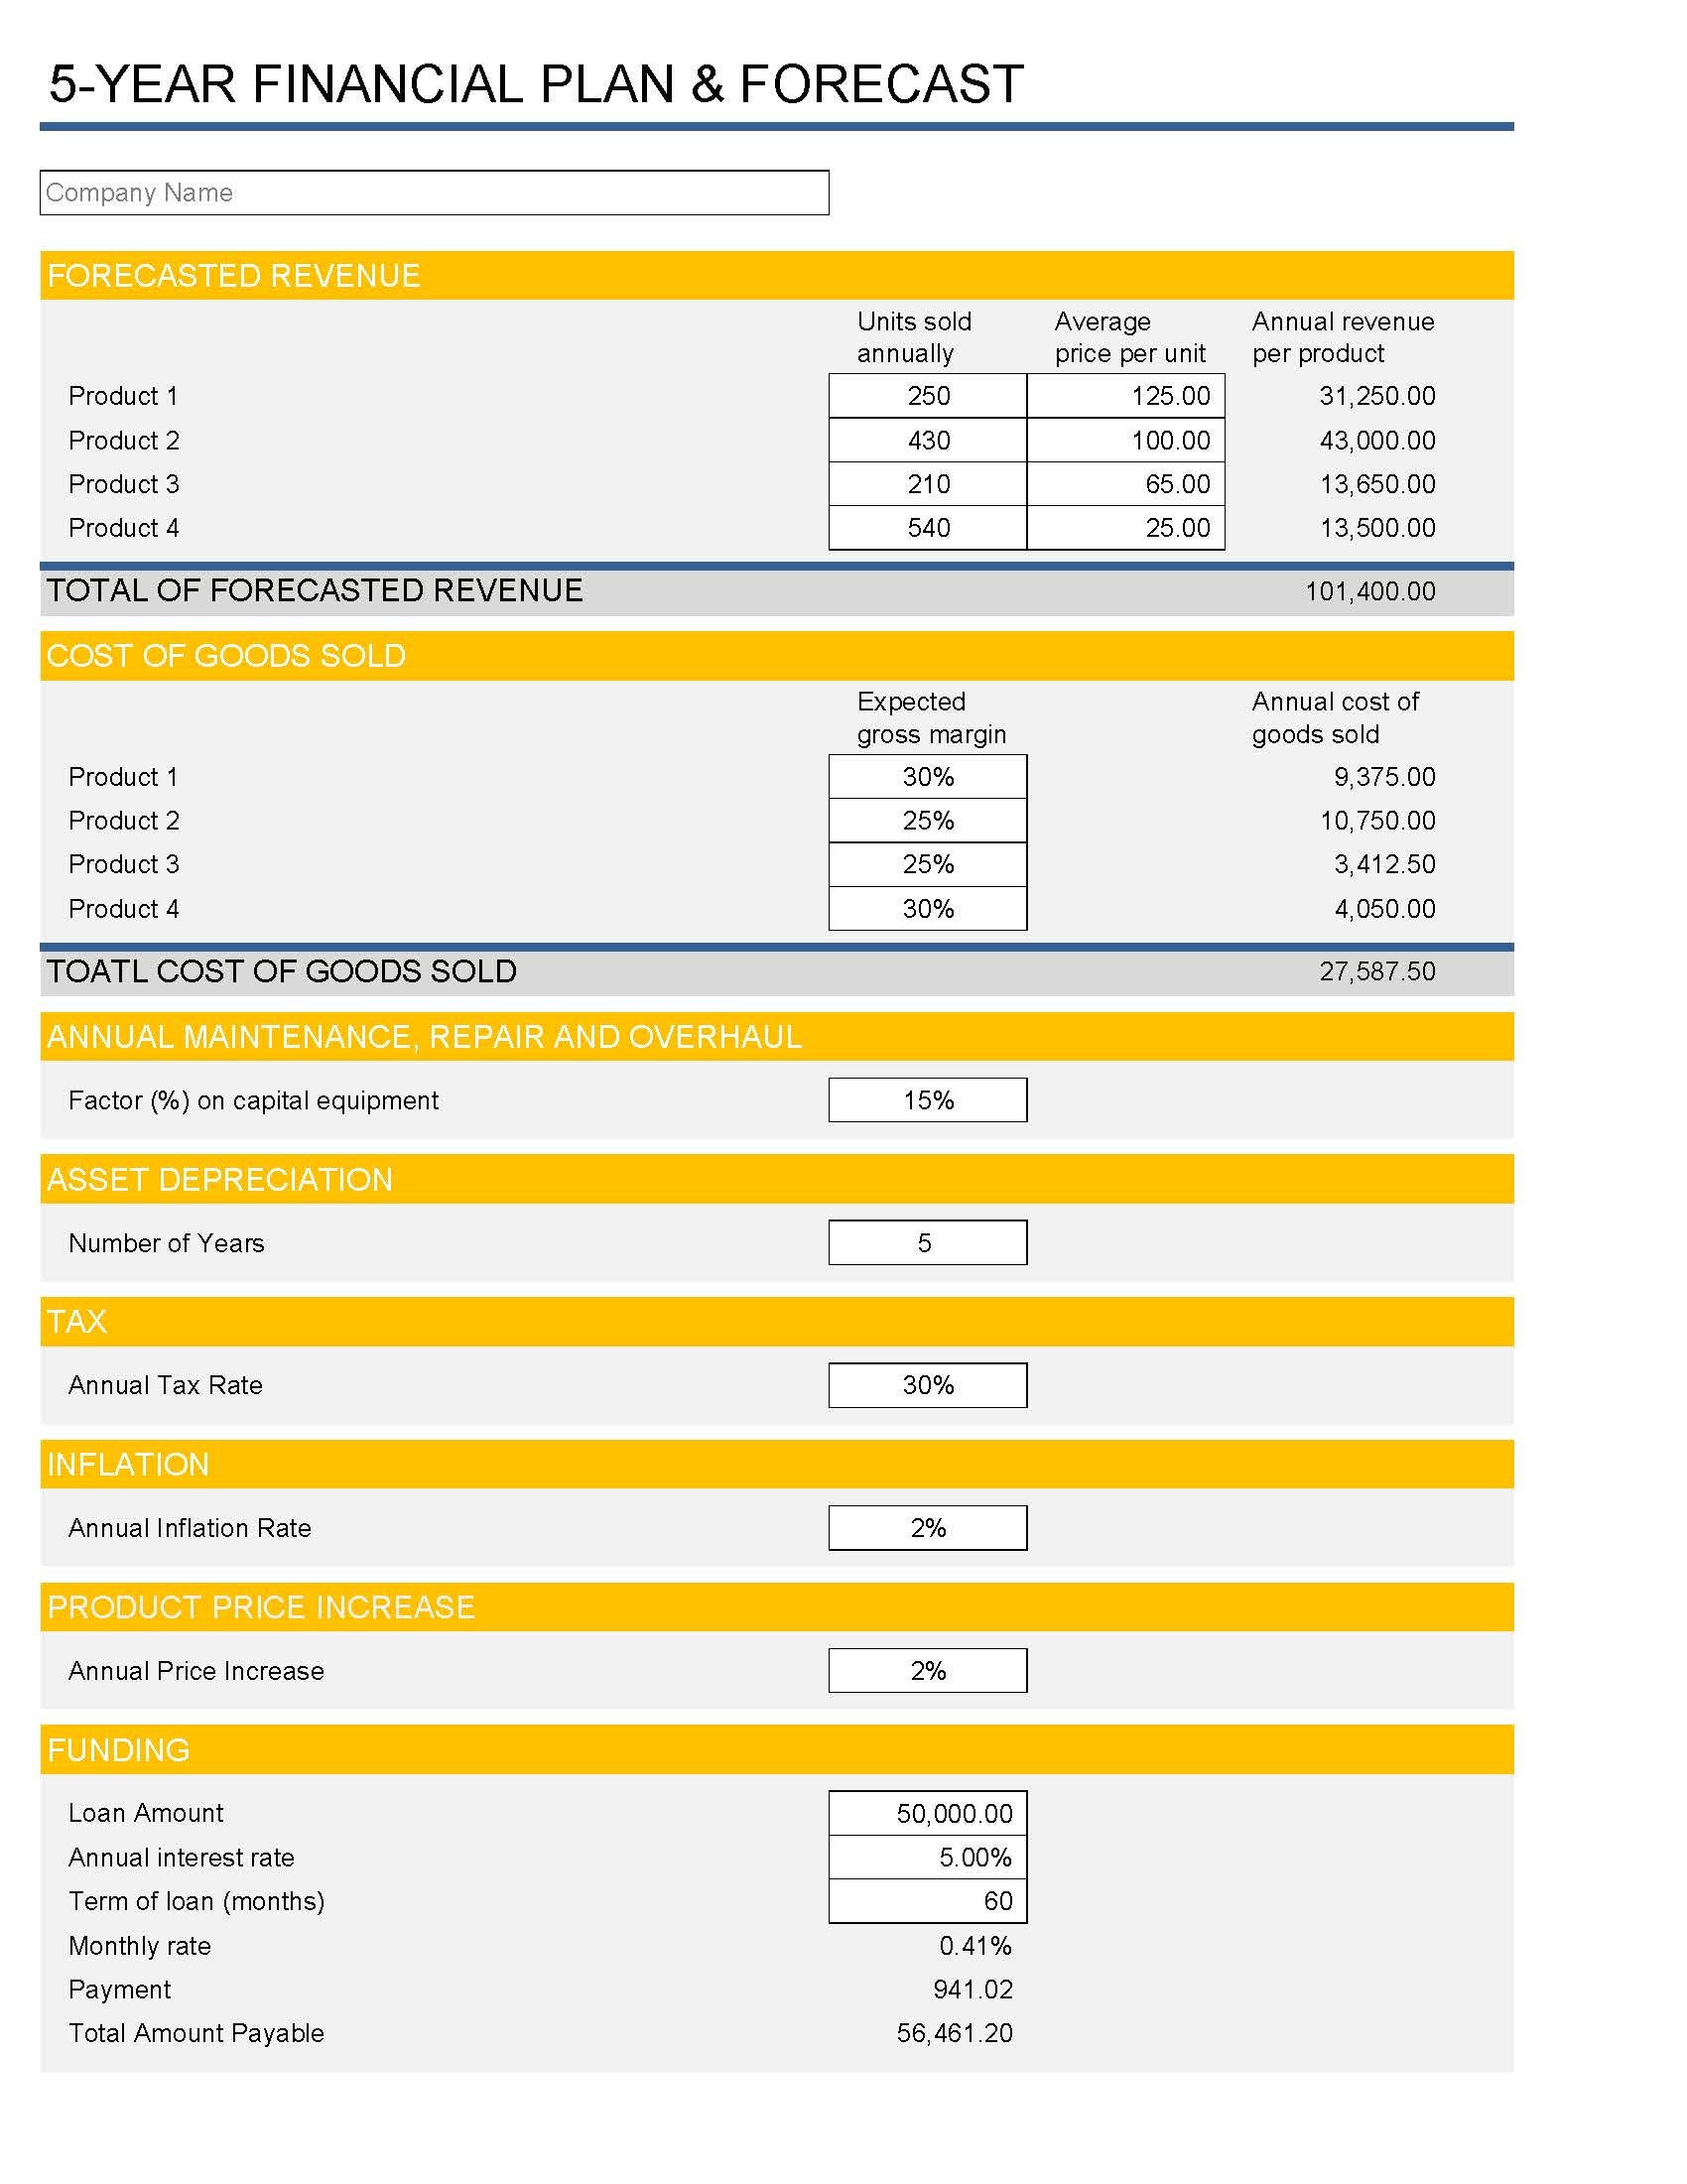
Financial information is an important part of operations analysis because operational decisions have financial consequences. However, financial analysis should be connected to the underlying process rather than treated as an isolated spreadsheet.
For example, a high labor cost may be caused by increased demand, excessive rework, inefficient scheduling, or an unnecessarily complex process. Simply cutting labor could make the operational problem worse.
A useful template can connect revenue, operating expenses, resource utilization, transaction volume, and process performance. This allows managers to investigate the operational drivers behind financial outcomes.
Scenario analysis is particularly useful. A business can model what might happen if transaction volume increases, processing time falls, staffing changes, prices change, or a manual task becomes automated.
Financial projections should always be labeled as projections when they are hypothetical. A model is a decision-support tool, not a guarantee of future performance.
The best operational financial analysis explains the relationship between resources, activities, outputs, and financial results. That relationship helps decision-makers understand not only what costs more, but why.
Research Methods for Operations Analysis
Interviews
Interviews are useful for understanding how employees and managers experience a process. Questions should focus on actual behavior rather than only asking whether people like a process.
Useful questions include: Where does work normally wait? Which step creates the most rework? What information is usually missing? Which exceptions occur frequently? Which system causes the most manual effort?
Interview findings should be compared with operational data. A widely reported problem that does not appear in transaction records may require additional investigation, while a data pattern that employees do not notice may reveal an invisible systemic issue.
Observation
Direct observation can reveal workarounds that employees may not mention during interviews. Watching a process from beginning to end can expose repeated data entry, unnecessary movement, waiting, unclear instructions, or informal approval practices.
Observation should be structured. Record the activity, timestamp, handoff, system used, exception, and relevant comment rather than relying entirely on memory.
Surveys
Surveys can collect information from a larger group of employees or customers. They are particularly useful when the analysis needs to compare perceptions across teams, locations, customer segments, or process stages.
Closed questions are easier to summarize quantitatively, while open questions can provide explanations. A good survey balances both without becoming so long that respondents abandon it.
System and Transaction Data
System records can provide objective evidence about volume, timestamps, status changes, transactions, and activity. They are often essential for calculating cycle time or identifying patterns that are difficult to observe manually.
However, system data still requires interpretation. A timestamp may record when a task was entered rather than when work actually started. Analysts should understand how each system field is generated before using it as evidence.

Common Mistakes When Creating an Operations Analysis Template
Collecting Too Much Data
More data does not automatically create better analysis. Excessive fields increase administrative effort and can reduce the likelihood that users keep the template current.
Every field should have a purpose. If no decision depends on a metric and no one reviews it, the field may not belong in the main operational template.
Using Undefined Metrics
A label such as “efficiency” can mean different things to different people. Define how the metric is calculated and what units it uses. This prevents inconsistent interpretation across teams.
Confusing Correlation With Cause
Two variables can change together without one causing the other. If customer complaints rise while staffing falls, the relationship may be worth investigating, but additional evidence is needed before claiming that reduced staffing caused the increase.
Ignoring Exceptions
Average performance can hide important exceptions. A process may have an acceptable average cycle time while a small group of high-value customers consistently experiences severe delays.
Building a Dashboard Before Fixing the Data
A sophisticated dashboard cannot compensate for inaccurate or inconsistent source data. Establish definitions, validation, ownership, and data-quality checks before investing heavily in visualization.
Failing to Close the Action Loop
If recommendations are not tracked after the analysis, the organization may repeatedly identify the same problems. Every important recommendation should have an owner, deadline, status, and success measure.

Best Practices for a High-Quality Digital Operations Analysis Template
Keep the template modular. Separate raw data, calculations, analysis, visualization, and actions so that users can update one layer without damaging another.
Use consistent definitions. Create a small data dictionary for important terms, metrics, categories, and calculation rules. This is especially valuable when multiple teams contribute information.
Design for recurring use. If the template will be reviewed monthly, make the monthly update process simple. If it is used quarterly, include a clear period field and comparison structure.
Make exceptions visible. Conditional formatting, status fields, priority categories, or exception reports can help managers focus attention where it is most needed.
Keep recommendations connected to evidence. A recommendation should reference the finding or operational problem that led to it. This makes management discussions more transparent.
Review the template itself. A template should evolve as the organization learns. Remove fields that are consistently unused, clarify ambiguous definitions, and add measures only when they provide genuine decision value.
Practical Solution: Build a Reusable Operations Analysis System
The most practical approach is to build the digital operations analysis template as a small system rather than a single crowded worksheet. Start with five connected components: an operational data register, process inventory, KPI summary, findings register, and action tracker.
First, create the operational data register. This is where structured records are collected. Include date, process, activity, owner, volume, status, actual result, target, and relevant source information. Keep raw entries as clean as possible.
Second, create the process inventory. List the workflows being reviewed, their owners, major steps, systems, inputs, outputs, dependencies, and known risks. This gives the analysis a process-level context that raw numbers cannot provide.
Third, create the KPI summary. Select only the indicators that directly support the management decision. Show current performance, target, variance, previous period, and trend where useful. Define every KPI so users understand exactly what it means.
Fourth, create a findings register. For each significant issue, record the evidence, observed impact, possible cause, confidence level, and business implication. Separating evidence from assumptions makes the analysis easier to review.
Fifth, create the action tracker. Every accepted recommendation should receive an owner, priority, deadline, status, expected benefit, and success measure. Review this tracker during the same recurring meeting used to review operational performance.
For small teams, this system can be implemented in one workbook. For larger organizations, the same structure can be distributed across business systems and connected to a reporting platform. The important point is that the underlying logic remains consistent.
When choosing a template format, use Excel when advanced calculations and offline analysis are central, Google Sheets when collaboration is important, Google Docs or Word when narrative reporting dominates, and PDF when a finalized snapshot must be distributed or archived.
For business clients, add a client-planning section that connects account priorities with operational capacity. Track active commitments, deadlines, service risks, owners, and next actions without collecting unnecessary personal information.
For financial decisions, connect operational drivers to revenue, expenses, utilization, and projected outcomes. For process-improvement projects, connect bottlenecks to root causes, actions, and measurable results.
Finally, schedule a review cycle. A template that is never reviewed becomes stale. A monthly operational review may be appropriate for fast-changing workflows, while quarterly reviews may be sufficient for slower processes.
The practical objective is simple: collect only useful information, analyze it consistently, make the findings visible, assign actions, and return to the data to determine whether the actions worked.
Reference Examples
The following reference examples illustrate spreadsheet, planning, charting, and analytical formats that can help readers visualize different ways a digital operations analysis system may be structured. They are visual examples rather than claims that a specific file is an official template for the exact keyword shown.
business clients planner template excel

Source: Wikimedia Commons
business clients planner template google docs

Source: Wikimedia Commons
business clients planner template google sheets

Source: Wikimedia Commons
business clients planner template free

Source: Wikimedia Commons
business clients planner template free download

Source: Wikimedia Commons
business clients planner template pdf

Source: Wikimedia Commons
business clients planner template excel free

Source: Wikimedia Commons
business clients planner template word

Source: Wikimedia Commons
business planner template free

Source: Wikimedia Commons
online planner template for business

Source: Wikimedia Commons
download business planner template

Source: Wikimedia Commons
business planner excel template

Source: Wikimedia Commons
Frequently Asked Questions
What is a digital operations analysis template?
A digital operations analysis template is a reusable spreadsheet, document, or digital framework for examining business processes, performance, resources, risks, costs, and improvement opportunities. It provides standardized fields so operational information can be collected and compared consistently.
What should a digital operations analysis template include?
A practical template should usually include business context, process inventory, data sources, KPI definitions, performance results, variance analysis, root causes, risks, recommendations, and an action tracker. The exact fields should be adapted to the process being analyzed.
Is Excel a good format for operations analysis?
Yes. Excel is useful when the analysis requires formulas, structured tables, calculations, scenario modeling, pivot tables, or offline editing. It works especially well when the underlying operational data is structured and relatively easy to maintain.
Is Google Sheets suitable for collaborative business analysis?
Yes. Google Sheets can be effective when multiple people need to contribute to or review operational information. Its collaborative nature can reduce version confusion, although permissions, ownership, definitions, and data-quality controls are still necessary.
Should an operations analysis be a document or spreadsheet?
It depends on the intended output. Spreadsheets are generally better for structured data and calculations, while documents are better for explanations, findings, recommendations, and formal reporting. Many organizations benefit from using both together.
How often should an operations analysis be updated?
The appropriate frequency depends on how quickly the process changes and how often decisions are made. Fast-moving operations may benefit from monthly or even weekly reviews, while stable processes may be reviewed quarterly or at major operational milestones.
What is the difference between an operations analysis and a business plan?
A business plan typically describes a company’s direction, market, offering, strategy, and financial expectations. Operations analysis focuses more deeply on how work is performed, how resources are used, how performance is measured, and where operational improvements are needed.
Can the template be used for business clients?
Yes. A client-oriented version can track account priorities, service commitments, project milestones, responsible owners, operational risks, and next actions. It should collect only information necessary for the business purpose and follow applicable privacy and access practices.
How can a template prevent operational problems from being repeated?
The template can maintain a historical record of findings, causes, decisions, actions, owners, and results. During recurring reviews, managers can compare previous actions with current performance and determine whether the intervention worked.
What makes an operations dashboard useful?
A useful dashboard highlights the metrics that matter for a specific decision, shows meaningful trends or variances, identifies exceptions, and makes ownership clear. A dashboard becomes less useful when it contains many attractive charts without clear decision relevance.
Conclusion
A well-designed digital operations analysis template turns operational information into a repeatable decision-making process. Its real value comes from structure: defining the scope, identifying processes, collecting reliable evidence, measuring performance, investigating causes, prioritizing findings, and assigning accountable actions.
The best template is not necessarily the largest or most visually complex. It is the one that people can understand, maintain, and use consistently. Excel can provide powerful calculations, Google Sheets can support collaboration, documents can explain findings, and PDF can preserve finalized reports. The format should follow the purpose of the analysis.
For businesses managing clients, projects, financial resources, service delivery, internal workflows, or growing operational complexity, a structured template provides a practical starting point for making problems visible and decisions more consistent.
The most effective implementation is iterative. Start with the decisions that matter most, collect only the information needed to support them, establish clear KPI definitions, connect findings to actions, and improve the template as the organization learns. Over time, the template can become more than a reporting document: it can become a repeatable operating discipline for improving performance.
When operational analysis is treated as an ongoing management practice rather than a one-time spreadsheet exercise, businesses gain a clearer connection between data, processes, resources, customers, and results. That is the central purpose of a digital operations analysis template: helping teams understand how the business works today, identify what needs to change, and make better-informed decisions about what to do next.
