The practical value of a quality forecast is not limited to predicting a single number. A useful template connects historical results with current conditions and future expectations. It can show whether inspection demand is increasing, whether defect levels are moving toward an unacceptable threshold, whether corrective actions are likely to remain open, and whether the quality team has sufficient resources for the coming period.
Searchers looking for a forecast for quality management template are often trying to solve several related problems at once. They may need an Excel workbook for calculations, a Word document for a formal plan, a PowerPoint presentation for management review, a PDF for distribution, or a collaborative spreadsheet for teams working in different locations.
The strongest solution is therefore not simply a blank form. It is a repeatable management system that defines inputs, forecasting assumptions, quality indicators, ownership, review frequency, escalation rules, and actions. The template should make it easy to compare planned quality performance with actual results and explain why the difference occurred.
This guide explains how to design, select, customize, and use such a template. It also covers project quality planning, quality-management roles, reporting formats, spreadsheet design, forecasting methods, common mistakes, practical examples, and a step-by-step implementation approach for organizations that want a usable system rather than another document that sits unused.
What a forecast for quality management template actually does
A quality management forecast is a forward-looking view of expected quality conditions. It can be prepared for a project, production line, service operation, department, program, supplier network, or organization. The forecast normally combines historical quality data with planned activity, known risks, resource availability, upcoming milestones, and management expectations.
The word “forecast” is important because a report describes what has already happened, while a forecast supports decisions about what may happen next. A quality report might state that 18 defects were recorded last month. A forecast asks whether the next month is likely to produce more or fewer defects and what actions should be taken before the expected result becomes reality.
A template gives this process a consistent structure. It can define fields for the reporting period, quality objective, baseline, current result, forecast result, variance, risk level, responsible owner, planned action, and review date. Standardization makes forecasts easier to compare from month to month and across projects.
Quality forecasting should not be confused with statistical prediction alone. A mathematical model can estimate future defect counts, but management still needs to interpret the result. A planned increase in production volume, for example, may cause more defects in absolute terms even when the defect rate remains stable or improves.
A practical template therefore separates volume measures from rate measures. Inspection count, production volume, customer cases, and completed deliverables describe the amount of activity. Defect rate, first-pass yield, acceptance rate, rework percentage, and overdue corrective actions describe performance relative to that activity.
When these measures are placed together, the forecast becomes much more useful. Management can see not only whether quality is improving but also whether the organization is prepared for the workload that is expected to arrive.
Why quality forecasting matters
Quality problems frequently become expensive when they are discovered late. A defect detected before a deliverable is released can usually be contained more easily than the same defect discovered after customer delivery, construction completion, production shipment, or system deployment.
Forecasting provides an opportunity to identify pressure points before they become failures. If inspection volume is expected to rise sharply, the organization can schedule additional inspectors. If a supplier’s nonconformance trend is worsening, procurement and quality teams can increase oversight. If corrective actions are accumulating, management can assign additional resources before the backlog becomes unmanageable.
Quality forecasting also supports better conversations between operational and quality teams. Without a shared model, operations may focus on output volume while quality teams focus on defects. A forecast connects both perspectives by showing expected workload, quality thresholds, resource requirements, and business consequences in one view.
Another benefit is early escalation. A forecast can use thresholds such as green, amber, and red conditions. Green may indicate that performance is expected to remain within target. Amber may indicate a developing risk that needs monitoring or preventive action. Red may indicate a forecast breach that requires immediate management intervention.
These thresholds should be defined before results are reviewed. Otherwise, teams can unintentionally move the goalposts after seeing the data. A strong template documents the target, tolerance, escalation trigger, responsible owner, and required response in advance.
Finally, forecasting encourages quality teams to think in terms of trends rather than isolated incidents. One defective unit may be insignificant, while a gradual rise in the same defect category over six reporting periods can reveal a systemic process problem.
Core components of a quality forecasting template
1. Forecast period and reporting date
Every forecast needs a clearly defined period. This may be weekly, monthly, quarterly, or aligned to project milestones. Monthly forecasting is common because it provides enough data for trend analysis without creating excessive administrative work.
The template should distinguish the date the forecast was prepared from the period being forecast. This becomes especially important when forecasts are revised. For example, a forecast prepared on September 5 may cover expected performance for September, while a revised forecast prepared on September 20 incorporates actual results from the first part of the month.
Version control is also valuable. Each revision should have a clear identifier, preparer, approval status, and revision date. This creates an audit trail and prevents teams from confusing an original forecast with an updated projection.
For recurring management reviews, use the same period definitions every time. Avoid switching between calendar months, financial periods, production batches, and project phases without explicitly recording the difference.
A consistent period structure makes trend comparisons much more reliable and allows spreadsheet formulas or dashboard charts to work without repeated manual adjustments.
2. Quality objectives
The next section should define what quality means for the activity being forecast. Objectives should be specific enough to measure. “Improve quality” is too broad to forecast effectively, whereas “maintain the accepted defect rate below the project threshold” gives the team a measurable direction.
Objectives may cover compliance, customer acceptance, defect prevention, process stability, inspection completion, corrective-action closure, supplier performance, or documentation accuracy. The appropriate objectives depend on the industry and the purpose of the operation.
For a software project, objectives might include requirements coverage, escaped defects, review completion, or unresolved high-severity issues. For manufacturing, they may include defect rate, first-pass yield, scrap, rework, and inspection completion.
For construction, objectives can include inspection completion, nonconformance closure, material approval status, testing completion, and punch-list reduction. A service organization might focus on complaint resolution, service accuracy, audit findings, or customer-impacting errors.
The template should also identify who owns each objective. A metric without an accountable owner often becomes a reporting exercise rather than a management tool.
A useful quality objective table can include the objective, measurement method, baseline, target, tolerance, forecast value, actual value, variance, owner, and action trigger. This creates a direct connection between forecasting and operational decision-making.
3. Historical baseline
A forecast is only as useful as the baseline behind it. Historical data provides context for deciding whether an expected result is normal, improving, deteriorating, or unusually volatile.
The baseline period should be appropriate to the process. A seasonal operation may need a year of history rather than only the previous month. A newly launched project may have limited history, requiring greater reliance on planned workload, expert judgment, and comparable activities.
Historical data should be cleaned before being used. Duplicate records, inconsistent defect classifications, missing inspection dates, changing definitions, and incomplete corrective-action records can create misleading trends.
It is also important to record changes in process conditions. A new supplier, revised specification, new product version, additional inspection stage, or major staffing change can make older data less comparable with current conditions.
The baseline should therefore include both numbers and context. A simple note explaining a major process change can prevent a future analyst from interpreting an artificial jump as a genuine deterioration in quality.

4. Forecast assumptions
Forecasts always contain assumptions, even when those assumptions are not written down. A professional template makes them visible. Typical assumptions include expected production volume, planned inspections, staffing levels, supplier capacity, project milestones, known risks, seasonal demand, and expected corrective-action completion.
For example, suppose a project expects twice as many inspections next month because several work packages will enter a testing phase. The forecast should not simply predict twice as many defects. It should consider whether inspection coverage, staffing, and historical defect rates are likely to remain comparable.
Assumptions should be stated in plain language. “Expected production volume remains within the approved plan” is more useful than leaving the underlying assumption implicit.
When an assumption changes, the forecast should be updated. This makes the model responsive instead of allowing a stale forecast to remain in circulation after the operating environment has changed.
A good template includes an assumptions field alongside the forecast. This is particularly helpful during management meetings because decision-makers can challenge the assumptions instead of debating the final number without understanding its basis.
5. Key quality indicators
Quality indicators should be selected according to the decisions the forecast needs to support. More metrics do not automatically produce better management. An overloaded template can hide the most important signals among dozens of low-value measures.
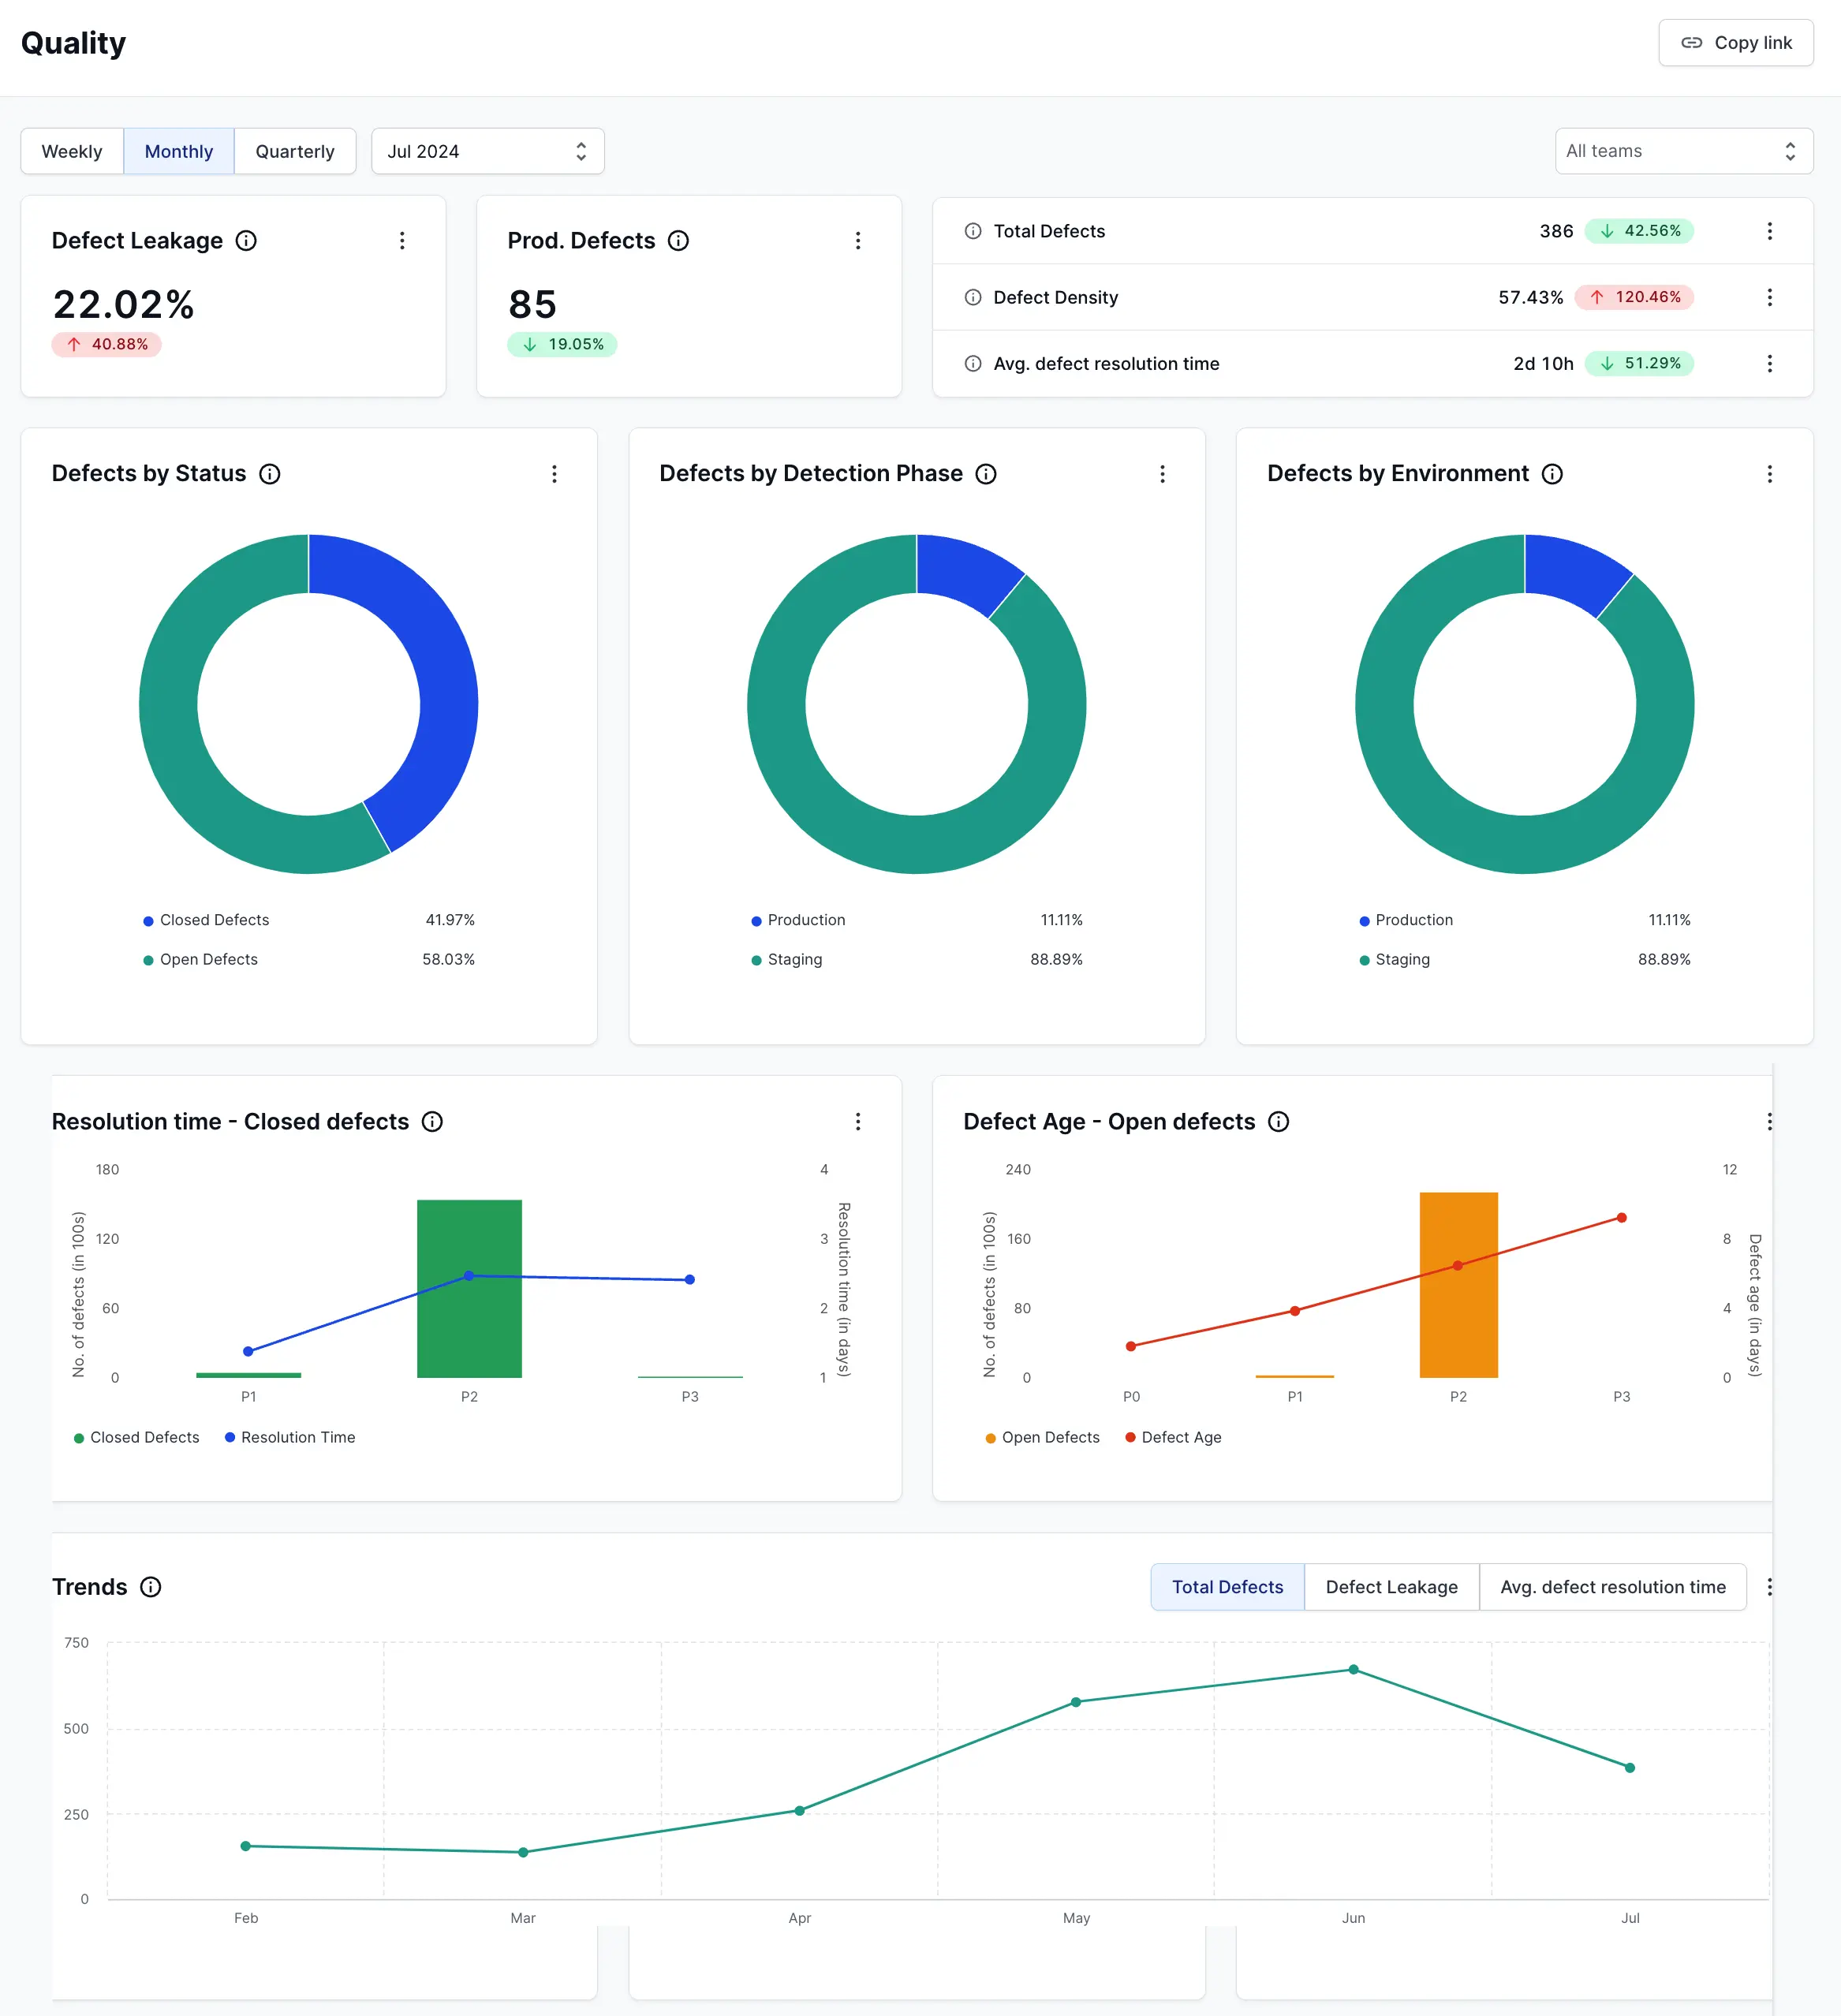
A practical dashboard may include defect rate, inspection completion, first-pass acceptance, rework, open nonconformances, corrective-action aging, customer complaints, audit findings, and supplier issues. The exact selection should reflect the organization’s quality risks.
Each indicator should have a definition. “Defect rate,” for example, could mean defects divided by inspected units, delivered units, opportunities, or another denominator. If the denominator changes, trend comparisons can become misleading.
Targets should also be defined carefully. A target may represent a maximum acceptable rate, a minimum required percentage, or a desired direction of improvement. The template should show which interpretation applies.
Where possible, pair leading and lagging indicators. Defects and complaints are often lagging indicators because they describe outcomes. Inspection completion, preventive-action implementation, training completion, and process-review coverage can provide earlier warning of future problems.
Forecasting methods that work in quality management
Simple trend forecasting
The simplest method is a moving trend based on previous periods. A team might calculate the average defect rate from the last three or six periods and use that as a starting point for the next forecast.
This approach is easy to explain and easy to maintain in Excel or Google Sheets. It works reasonably well when the process is stable and there are no major changes expected in workload or operating conditions.
The limitation is that a simple average can hide recent deterioration. If quality has steadily declined, an average of older and newer periods may produce a forecast that looks safer than the latest trend suggests.
To address this, teams can give greater weight to recent periods. A weighted moving average can reflect current conditions more strongly than older observations.
Even a basic trend method should be accompanied by an explanation of unusual events. Forecasting is not merely a spreadsheet formula; professional judgment remains important when the environment changes.
Volume-adjusted forecasting
Quality forecasts become more useful when expected workload is incorporated. Suppose a production line normally records a small number of defects per thousand units. If production volume is expected to rise substantially, the absolute number of expected defects may rise even when the defect rate remains unchanged.
Volume-adjusted forecasting separates these effects. The model can estimate expected activity first and then apply an appropriate quality rate. This is more informative than simply carrying forward last month’s defect count.
The same concept applies to inspections, customer cases, software releases, construction work packages, and other quality activities. A higher workload should not automatically be interpreted as poorer quality.
Management should review both the rate and the absolute count. A stable rate combined with rapidly increasing volume may still create a significant workload for inspectors and corrective-action teams.
When building the template, include fields for expected volume, expected quality rate, forecast issue count, available capacity, and resulting workload. This makes the forecast useful for staffing and resource planning.
Threshold and scenario forecasting
Scenario forecasting is useful when the future contains uncertainty. Instead of presenting one supposedly precise result, the template can show a base case, an optimistic case, and a risk case.
For example, a base case might assume normal inspection performance, the optimistic case might assume preventive actions reduce defects, and the risk case might assume a supplier problem increases nonconformances.
Scenario planning helps management understand the range of possible outcomes. It also makes the forecast more actionable because each scenario can have predefined responses.
Thresholds are particularly helpful for escalation. A quality team might decide that a forecasted rate above the approved tolerance triggers a management review, while a smaller deviation requires monitoring only.
The threshold itself should be linked to the applicable project requirement, customer expectation, internal standard, contract, specification, or other legitimate basis. Avoid inventing arbitrary thresholds simply because they look good on a dashboard.

How to structure the spreadsheet
Spreadsheet-based forecasting works well when the underlying data is organized cleanly. Keep raw records separate from calculations and separate again from the management dashboard. This prevents users from accidentally overwriting source data while editing presentation fields.
A practical workbook can contain four main sheets: Data, Calculations, Forecast, and Dashboard. The Data sheet stores inspection or quality records. Calculations transform the raw information into standardized measures. Forecast contains assumptions and forward-looking values. Dashboard summarizes the results for management.
Use consistent column names and data types. Dates should be actual date values rather than text. Status fields should use controlled values. Defect categories should come from a defined list rather than allowing unlimited variations such as “late,” “Late,” “delayed,” and “delay issue.”
Formula logic should be visible enough to audit. Complex formulas may be appropriate, but they should not be so opaque that nobody can explain where a forecast came from.
Protect formula cells when necessary and provide clear input areas. A template becomes much safer when users can immediately see which fields they are expected to edit and which cells are calculated automatically.
Suggested Excel fields
A useful data table might include Record ID, Date, Project or Department, Process, Inspector, Supplier, Product or Deliverable, Inspection Type, Result, Defect Category, Severity, Quantity Inspected, Quantity Defective, Corrective Action, Owner, Due Date, Closure Date, and Status.
From these fields, the workbook can calculate rates and aging indicators. For example, defect rate can be calculated from defective quantity divided by inspected quantity when those definitions are appropriate for the process.
Corrective-action aging can be calculated from the opening date and current date, while overdue status can compare the due date with the reporting date. These calculations should be consistent across the organization.
Use separate fields for facts and judgments. “Defect observed” is a factual field, while “risk rating” is an assessment. Keeping them distinct helps reviewers understand which information came directly from records and which was assigned by an analyst or manager.
Where data is incomplete, use a clear missing-data status rather than silently treating blanks as zero. A missing inspection result is not necessarily the same thing as a zero defect result.
Using the template in Google Sheets
Google Sheets can be effective when several people need access to the same quality forecast. Collaborative editing allows quality, project, operations, and management teams to work from a shared source rather than emailing multiple versions of the workbook.
The main design principle remains the same: separate raw data, calculations, inputs, and presentation. Cloud collaboration does not eliminate the need for data governance.
Permissions should reflect responsibilities. People entering inspection records do not necessarily need permission to modify formulas or management assumptions. A protected calculation area can reduce accidental changes.
Version history is useful when a forecast changes unexpectedly. Reviewers can identify when a value was changed and investigate whether the change resulted from new data, a revised assumption, or an accidental edit.
Google Sheets also works well for controlled review workflows when comments and shared discussions are needed. However, organizations with formal records-management requirements should determine whether the platform and configuration meet their specific retention, access, and approval needs.
Using Excel for quality forecasting
Excel remains particularly useful when users need advanced formulas, pivot tables, charts, scenario analysis, or offline work. A quality forecast workbook can begin as a simple table and gradually become a more sophisticated management dashboard.
Pivot tables can summarize defects by period, process, supplier, product, severity, or responsible department. Charts can then show trends without forcing managers to read every transaction.
Conditional formatting can highlight forecast breaches, overdue corrective actions, and missing information. However, visual alerts should reinforce defined rules rather than replace them.
Excel also makes it easy to build what-if scenarios. Users can change expected volume, defect assumptions, or staffing levels and observe the resulting workload. This is especially useful for planning inspection resources before a major project phase.
The main risk is uncontrolled customization. Once several people copy, rename, and modify workbooks independently, formulas can diverge. A master template with documented version control is therefore preferable to an unlimited collection of personal copies.
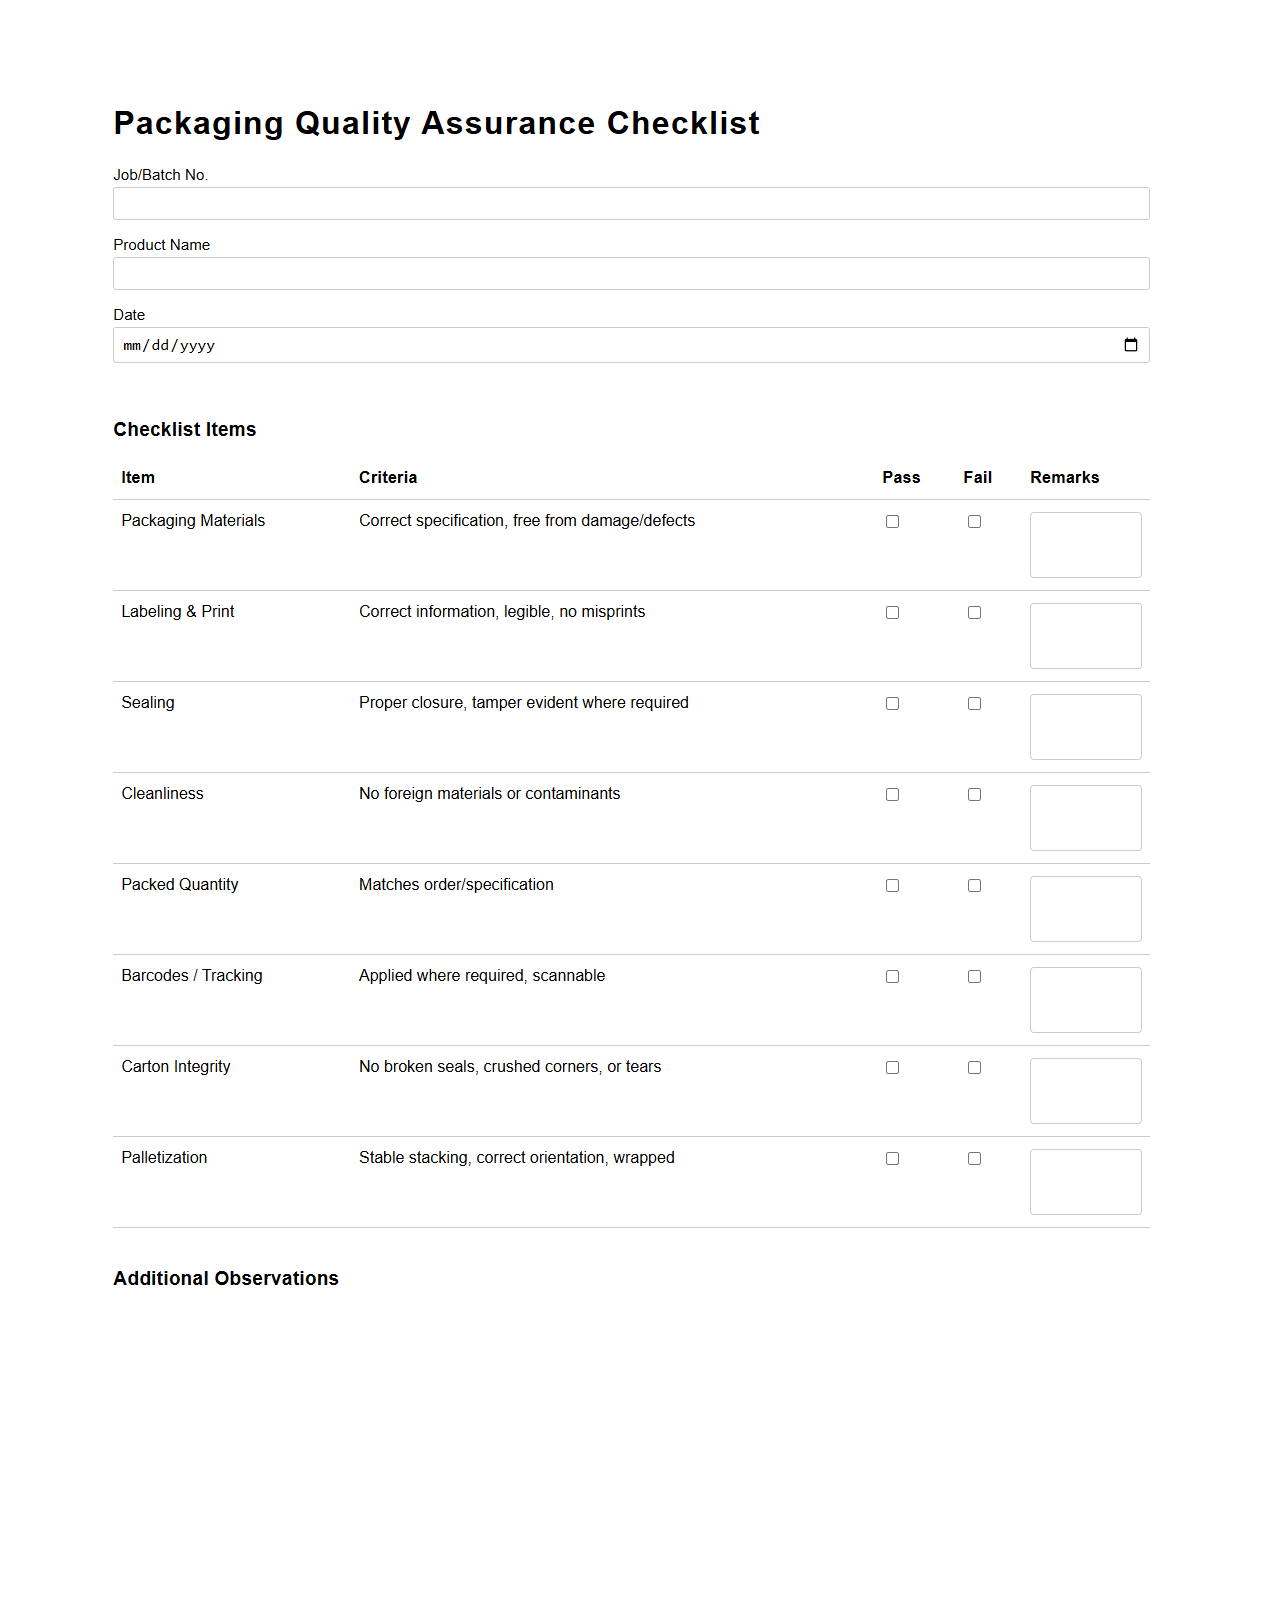
Using quality management reports with the forecast
A forecast should connect directly with reporting. A monthly report can compare what was forecast with what actually occurred, explain significant variances, and document actions for the next reporting cycle.
The report should not simply reproduce every spreadsheet row. Management generally needs a concise view of the most important changes, risks, causes, decisions, and actions.
A useful report structure starts with an executive summary. It then presents key indicators, significant variances, major quality issues, corrective actions, emerging risks, and the forecast for the next period.
Where a forecast was materially wrong, the team should investigate why. The purpose is not to blame the person who prepared the forecast. The purpose is to improve the forecasting model, assumptions, data quality, or operational controls.
Over time, forecast accuracy itself becomes a useful management indicator. If forecasts consistently underestimate workload, the planning assumptions may need adjustment. If they consistently overestimate problems, the model may be overly conservative.
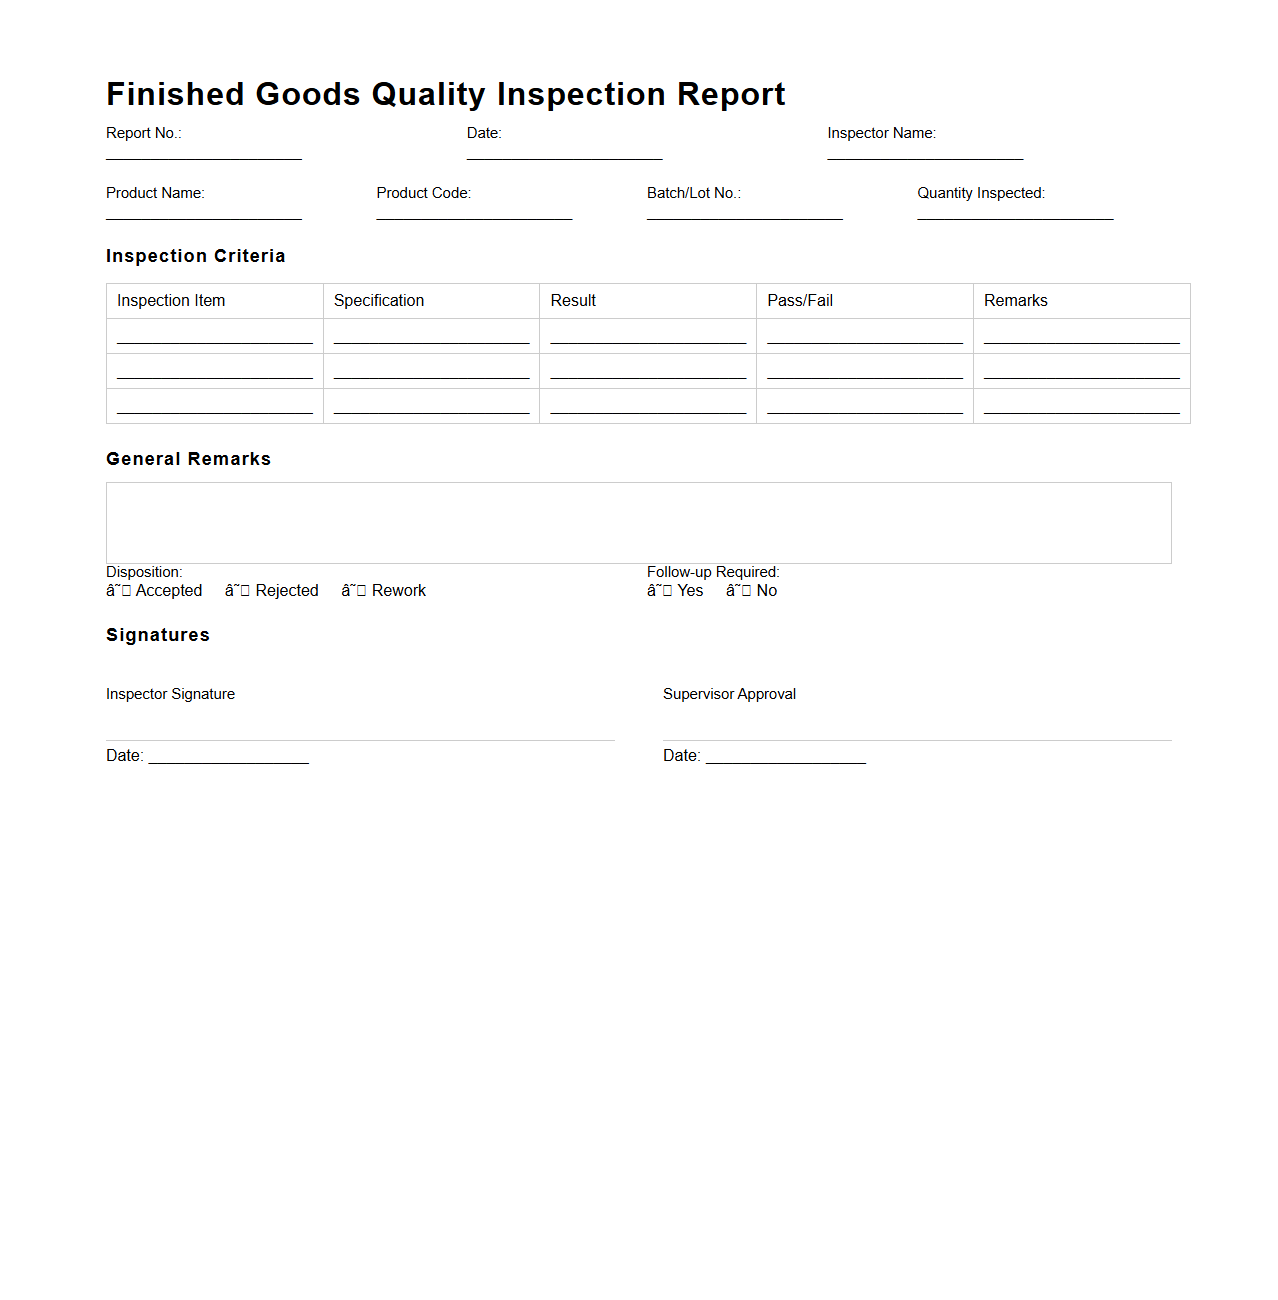
Quality management positions and accountability
Forecasting works best when responsibilities are explicit. Different organizations use different titles, but common quality-management responsibilities can include quality manager, quality engineer, quality assurance specialist, quality control inspector, project manager, process owner, auditor, document controller, and corrective-action owner.
The quality manager or equivalent leader may own the overall quality framework and management review process. Quality engineers may analyze process performance, investigate recurring defects, and support improvement projects.
Quality control personnel often collect inspection evidence and verify whether outputs meet defined criteria. Project managers coordinate quality requirements with scope, schedule, resources, and stakeholder expectations.
Process owners remain important because quality problems are frequently rooted in the process rather than the inspection itself. A quality team can identify a recurring defect, but the process owner may be responsible for changing the underlying workflow.
The template should therefore contain an accountability field for each forecast metric or action. Avoid assigning every item to “Quality Department.” A forecast becomes actionable when a specific role can make or coordinate the required decision.
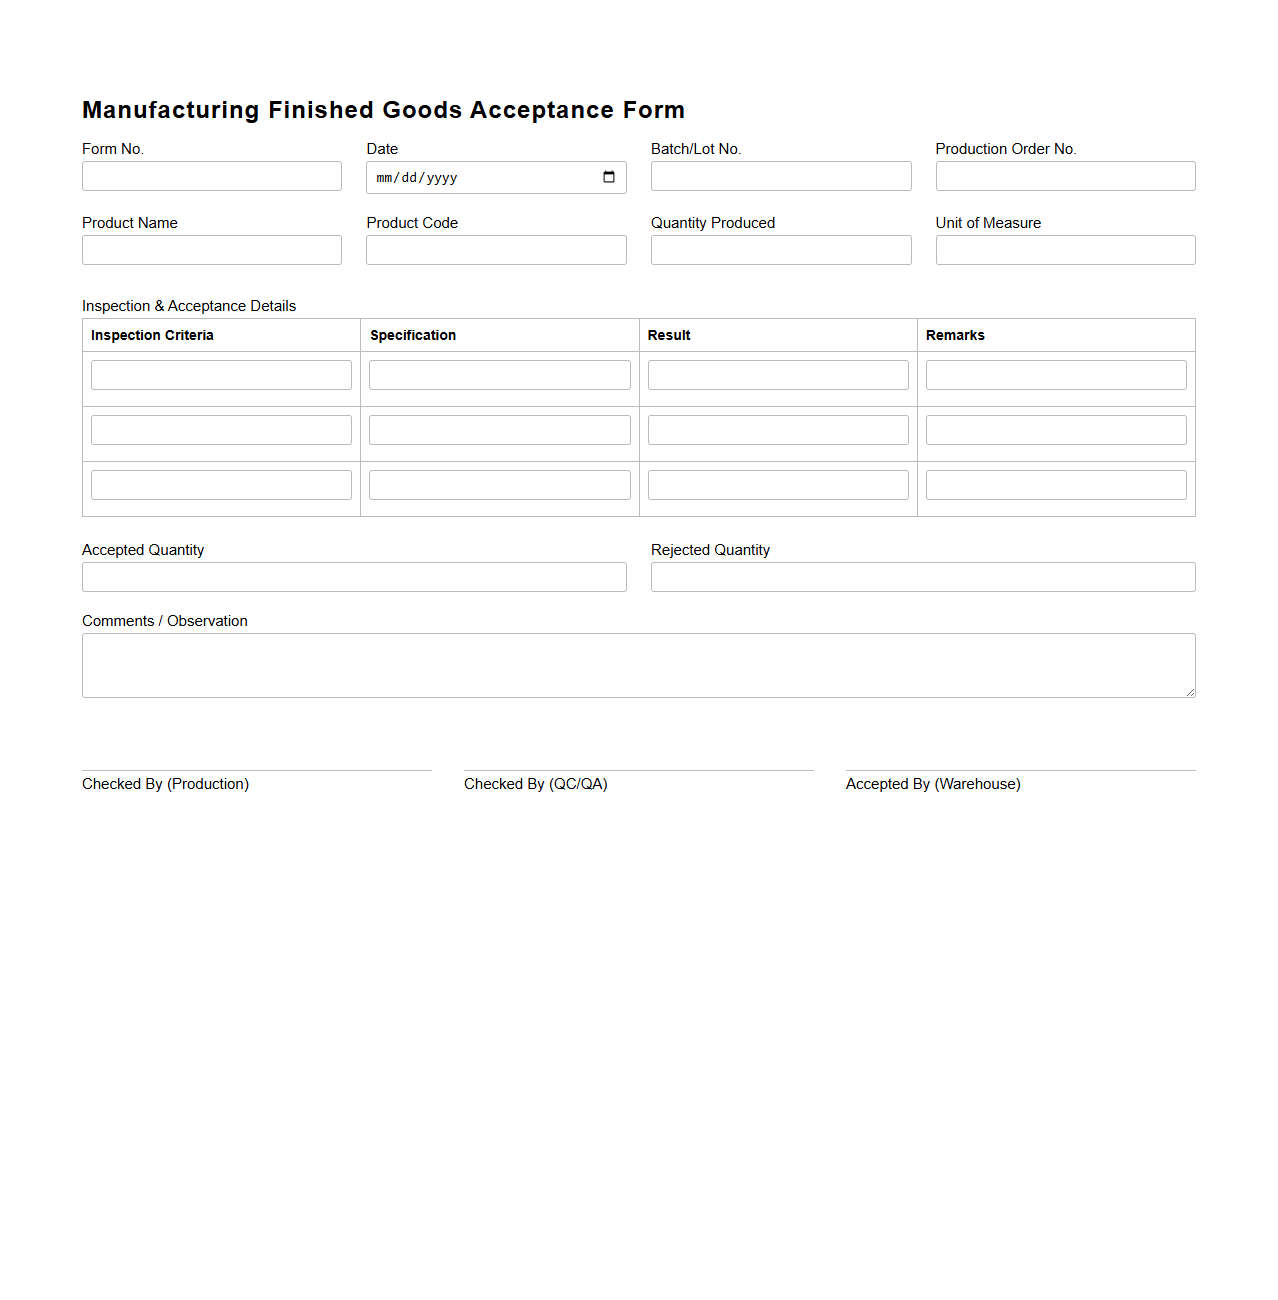
Building a quality management program template
A quality management program is broader than a single forecast. It describes how quality is planned, assured, controlled, measured, reviewed, and improved across an activity or organization.
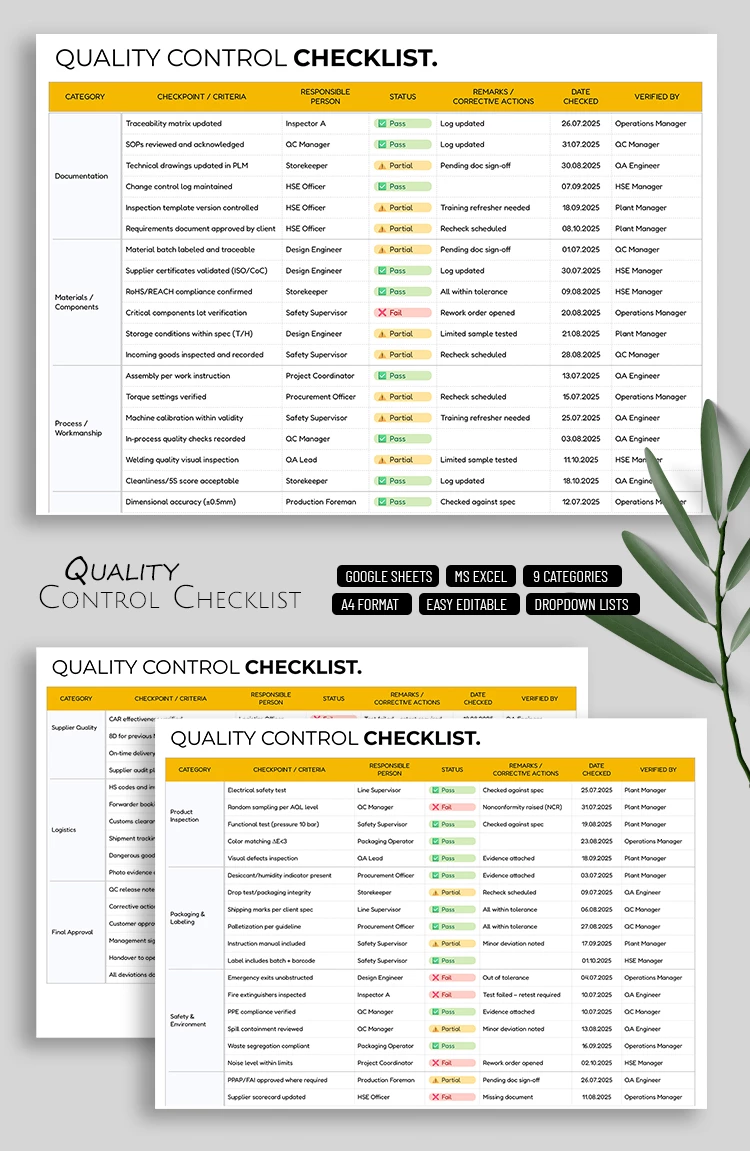
A strong program template can include purpose, scope, applicable requirements, quality objectives, governance, roles, procedures, inspection methods, measurement systems, records, audits, corrective actions, management review, reporting, and continual improvement.
The forecast should sit within this wider system. The program defines what quality means and how it is controlled, while the forecast provides a forward-looking view of expected performance and resource requirements.
For a project, the program may need to connect with the project schedule and deliverable structure. Quality activities should be planned at the same level where work is actually managed, rather than maintained as a completely separate administrative process.
For an operational organization, the program may be more stable and reusable, while individual forecasts change with production volumes, customer demand, supplier conditions, staffing, and improvement activities.
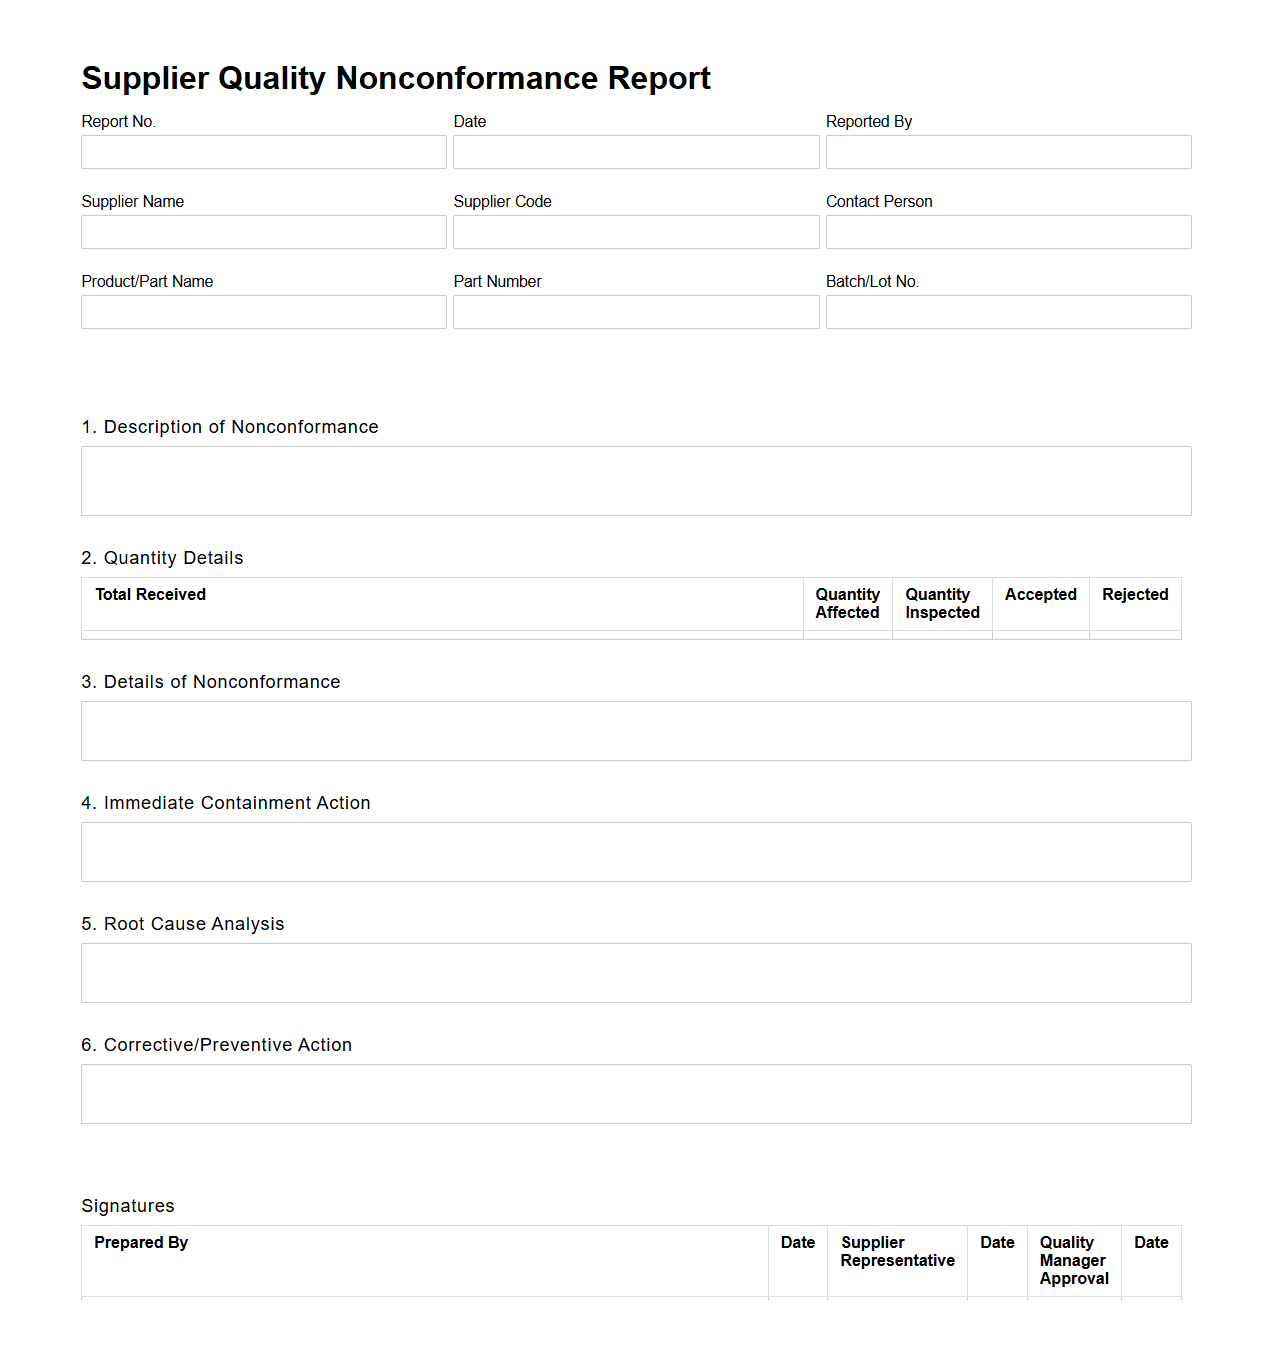
Project quality management template design
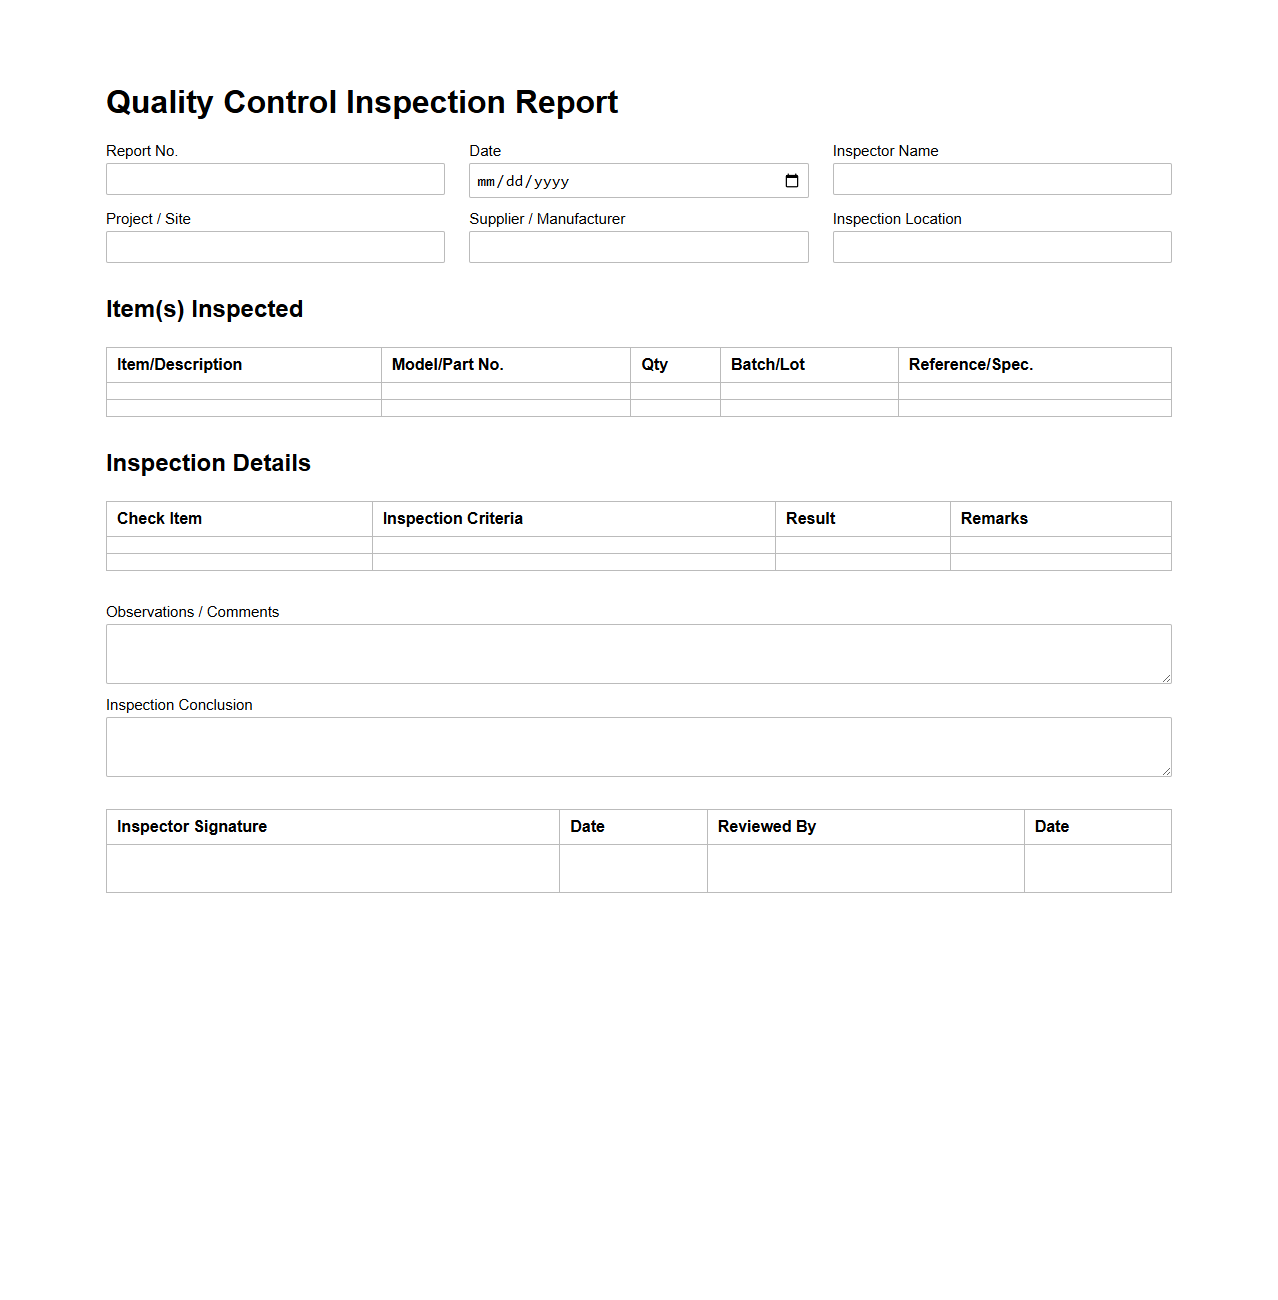
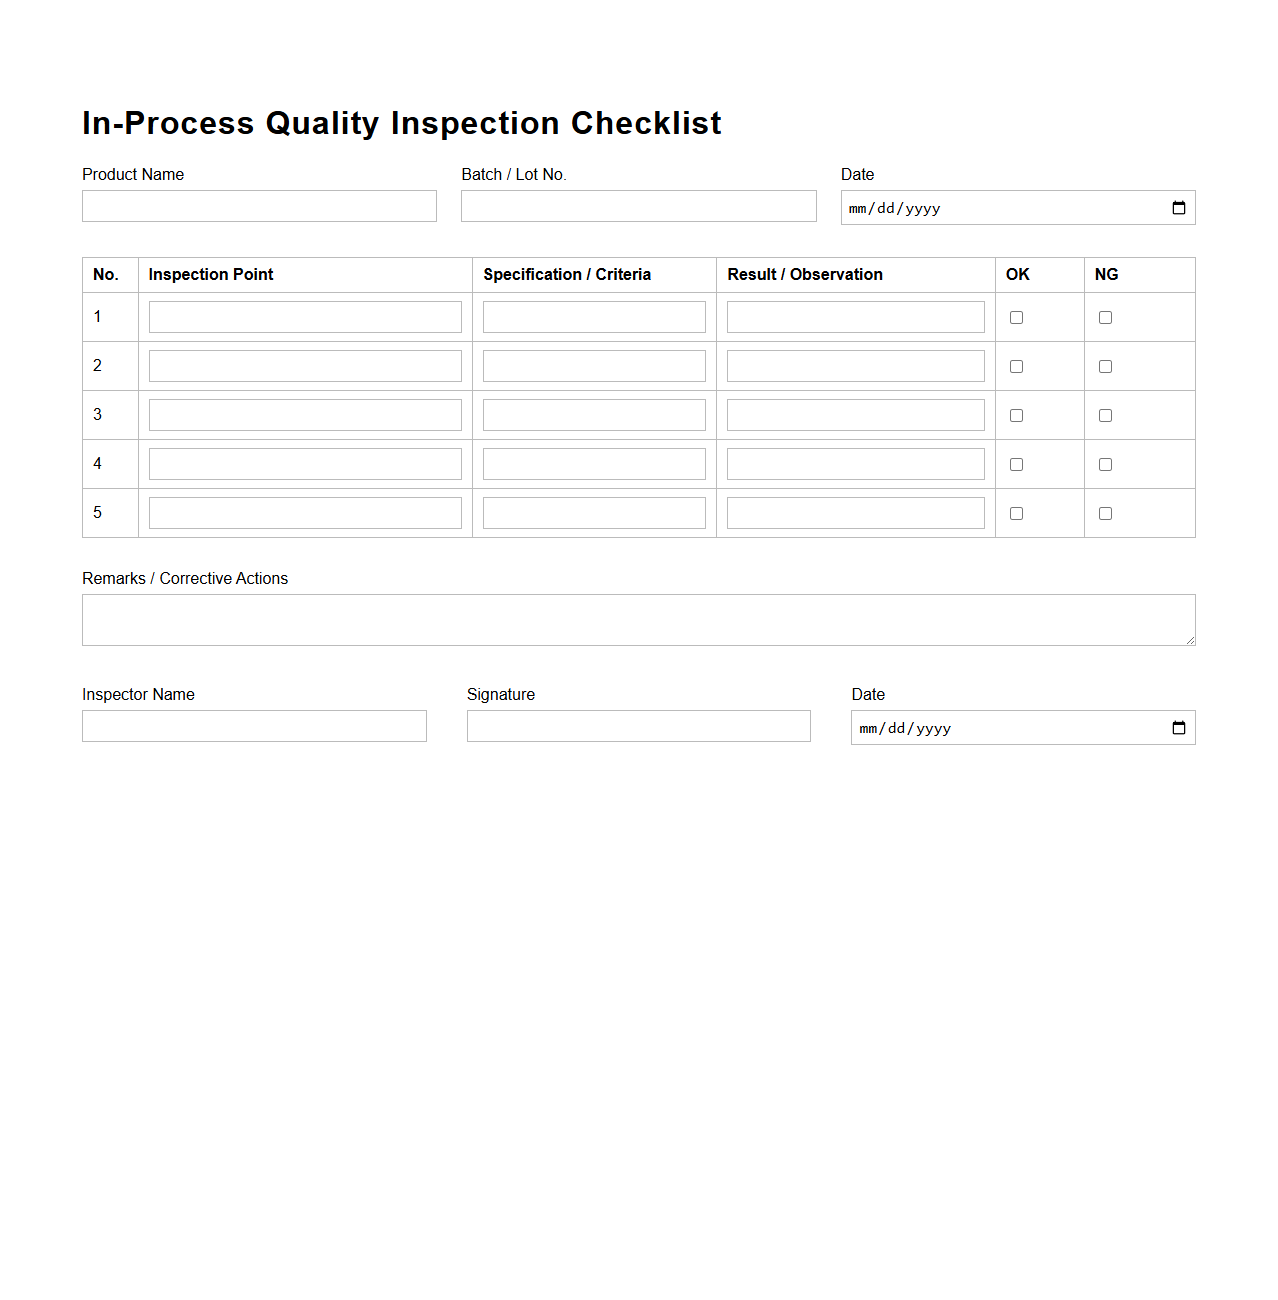
A project quality management template should connect project requirements with measurable quality controls. It should identify what must be delivered, how acceptance will be evaluated, who performs verification, what evidence must be retained, and what happens when a requirement is not met.
Project quality planning is most effective when started early. Waiting until delivery to define acceptance criteria creates avoidable uncertainty because teams may discover that different stakeholders have different interpretations of “complete” or “acceptable.”
The template should include quality objectives, standards or specifications, responsibilities, inspection and testing activities, acceptance criteria, quality records, audit activities, nonconformance handling, corrective actions, and reporting arrangements.
Milestones are particularly useful. A project may have quality gates at design approval, material approval, installation, testing, commissioning, user acceptance, and final handover. The exact gates depend on the project type.
A forecast can then estimate upcoming quality workload by milestone. This creates a bridge between project scheduling and quality management, allowing teams to identify periods when inspections, testing, reviews, or approvals are likely to become resource constraints.
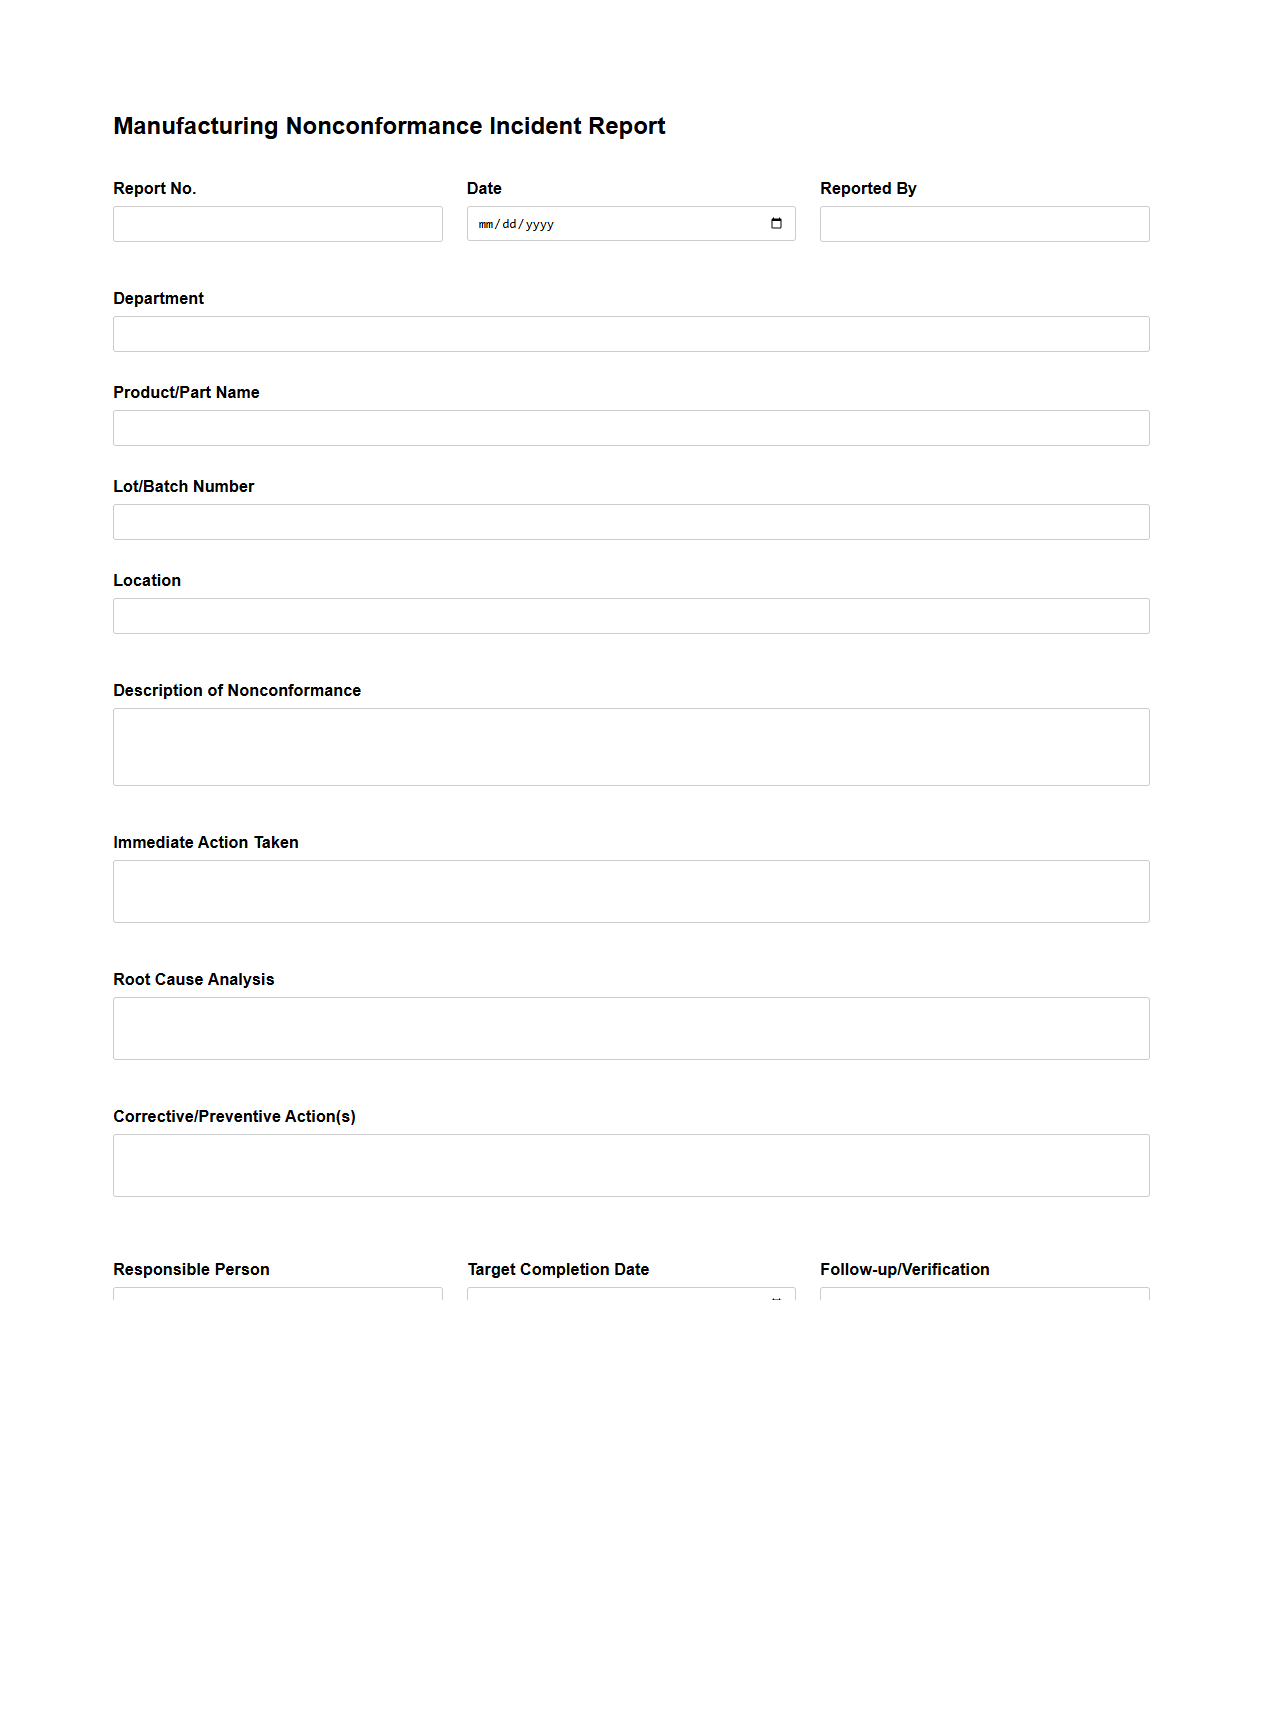
Managing nonconformances and corrective actions
Nonconformances should be treated as structured data rather than scattered emails. Each issue should have an identifier, description, date, source, severity or priority where appropriate, responsible owner, containment action, corrective action, due date, and closure evidence.
The forecast can use this information to estimate future workload. If many corrective actions are open and their average age is increasing, the organization may need additional capacity even if new defects remain stable.
Corrective actions should also be evaluated for effectiveness. Closing an action administratively does not necessarily prove that the underlying problem has been eliminated.
Trend analysis can reveal recurring categories. If several incidents have similar root causes, a systemic improvement may be more valuable than treating each case separately.
A quality forecast should therefore include both incoming workload and existing backlog. Forecasting only new defects can underestimate the amount of work required to restore stable performance.
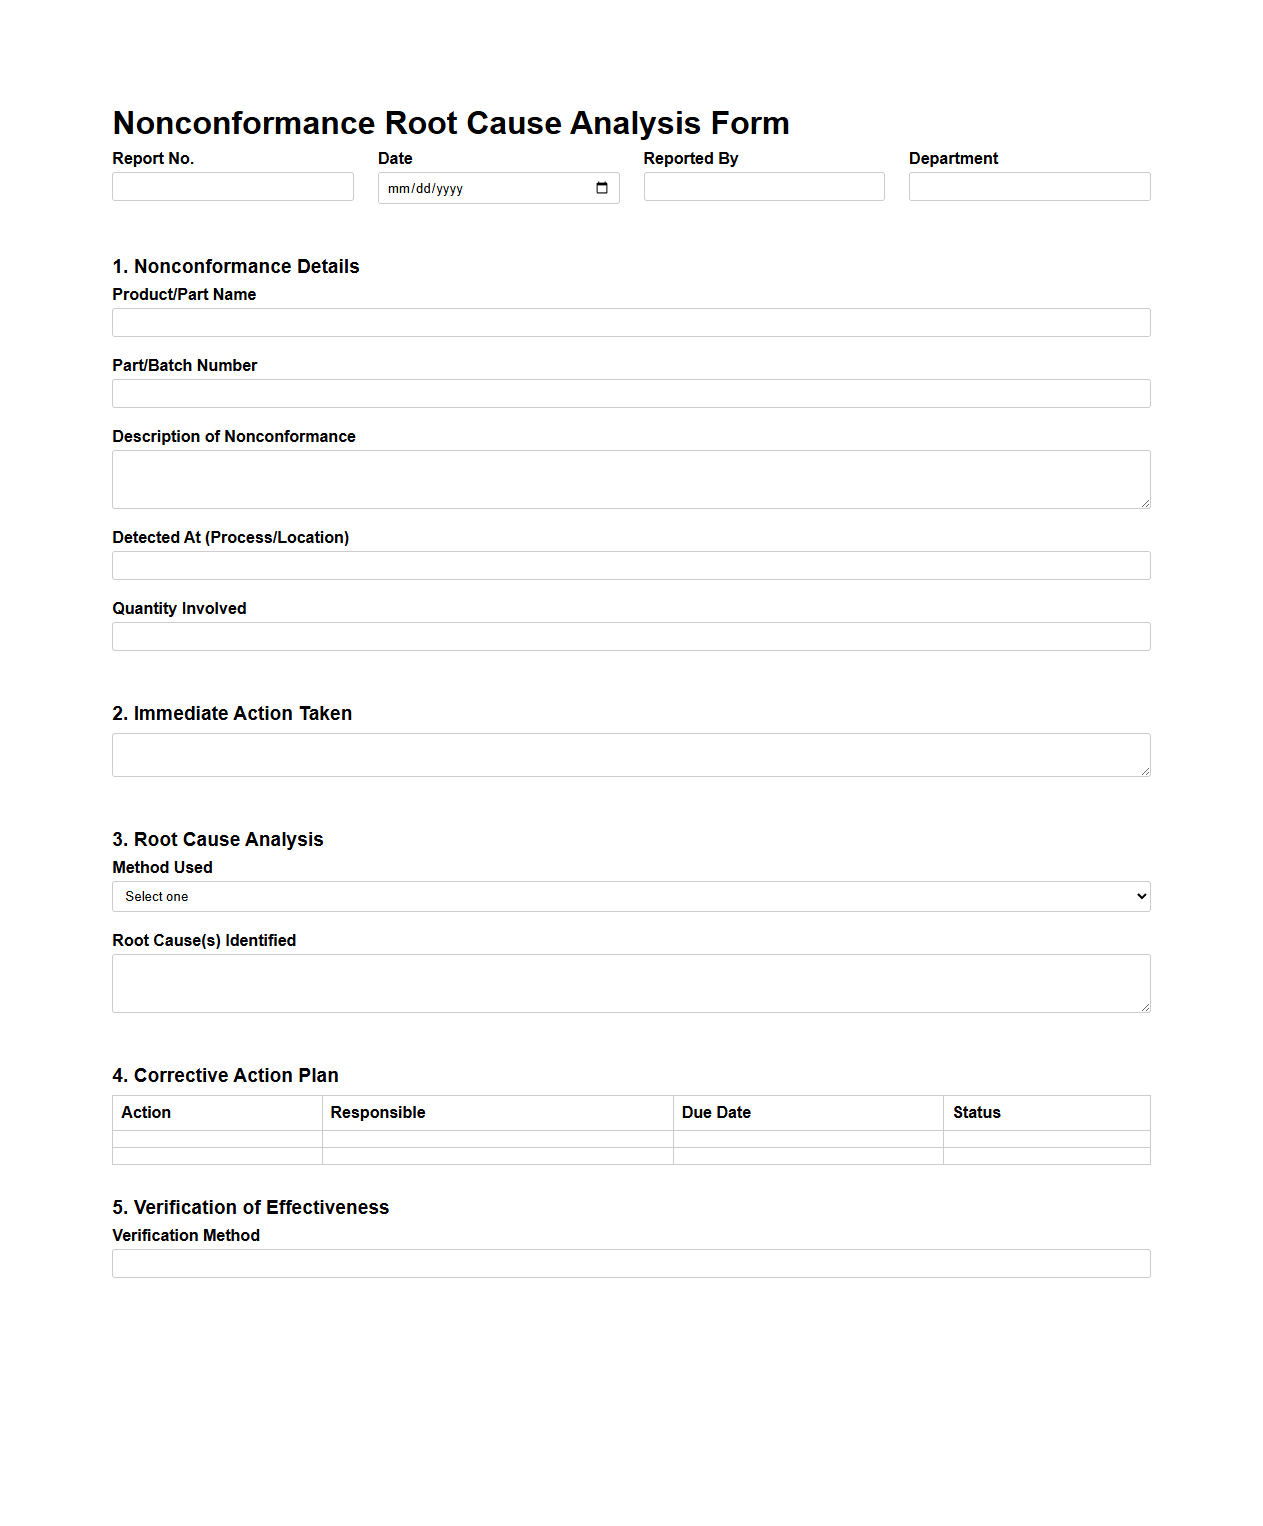
Root cause analysis and forecasting
Root cause analysis is important because forecasting should lead to better decisions, not merely better prediction. When the same problem appears repeatedly, the organization should investigate whether the cause is related to process design, materials, equipment, training, instructions, measurement, environment, or another factor.
A fishbone-style analysis can help teams organize possible causes before evidence is evaluated. The diagram should support structured investigation rather than become a decorative page added to a report.
The forecast can then incorporate the expected impact of corrective measures. If a verified process change is expected to reduce a recurring problem, the forecast assumptions should document when the change becomes effective and what evidence will be used to assess it.
Forecast improvement should be evidence-based. A team should not automatically assume that every corrective action will produce the desired result. The forecast can instead show an expected range and update it as new evidence becomes available.
This creates a learning cycle: forecast, observe, compare, investigate, improve, and forecast again. The value of the template increases when each reporting cycle makes the next cycle more informed.
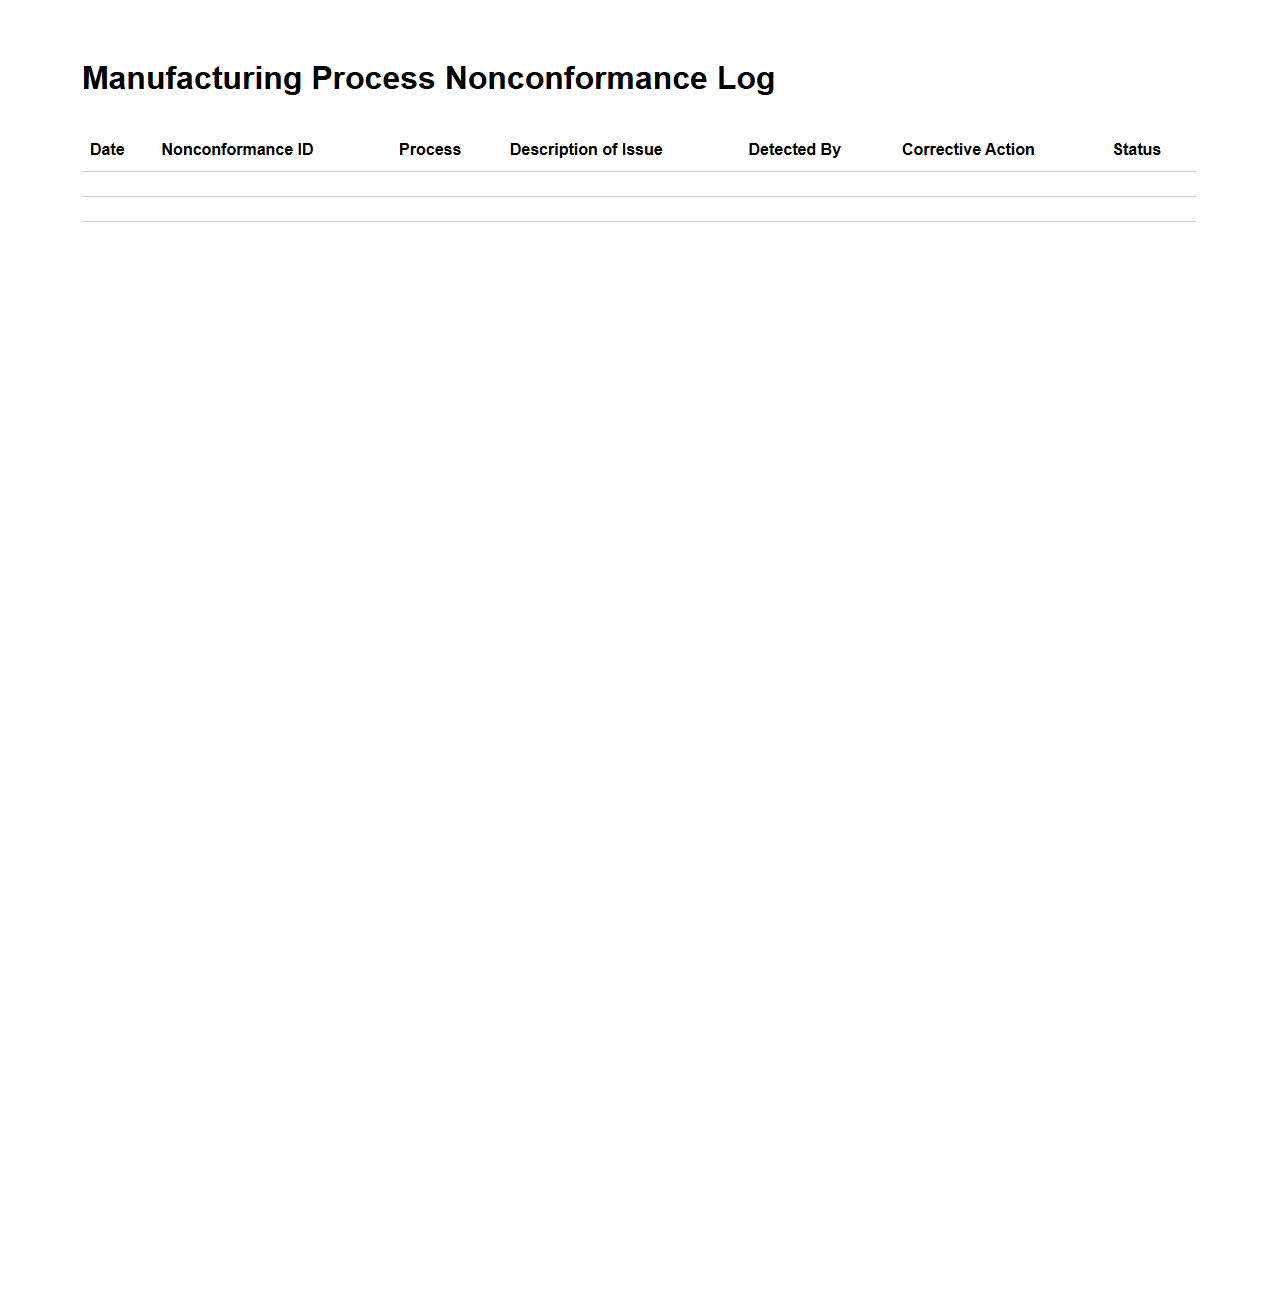
Data quality requirements for forecasting
Bad source data can produce a highly polished but unreliable forecast. Data quality should therefore be treated as part of quality management itself.
Common problems include duplicate records, missing dates, inconsistent categories, incorrect quantities, closed issues that remain marked open, and records entered after the reporting period has already been finalized.
Define ownership for data entry and validation. If several departments enter information, use common definitions and controlled lists so that the same event is classified consistently.
Data completeness can be monitored as an indicator. For example, a management dashboard can show the percentage of records containing required fields or the number of quality cases awaiting classification.
Forecast confidence should decrease when important data is incomplete. Instead of presenting a highly precise number based on poor information, document the uncertainty and explain what additional evidence is needed.
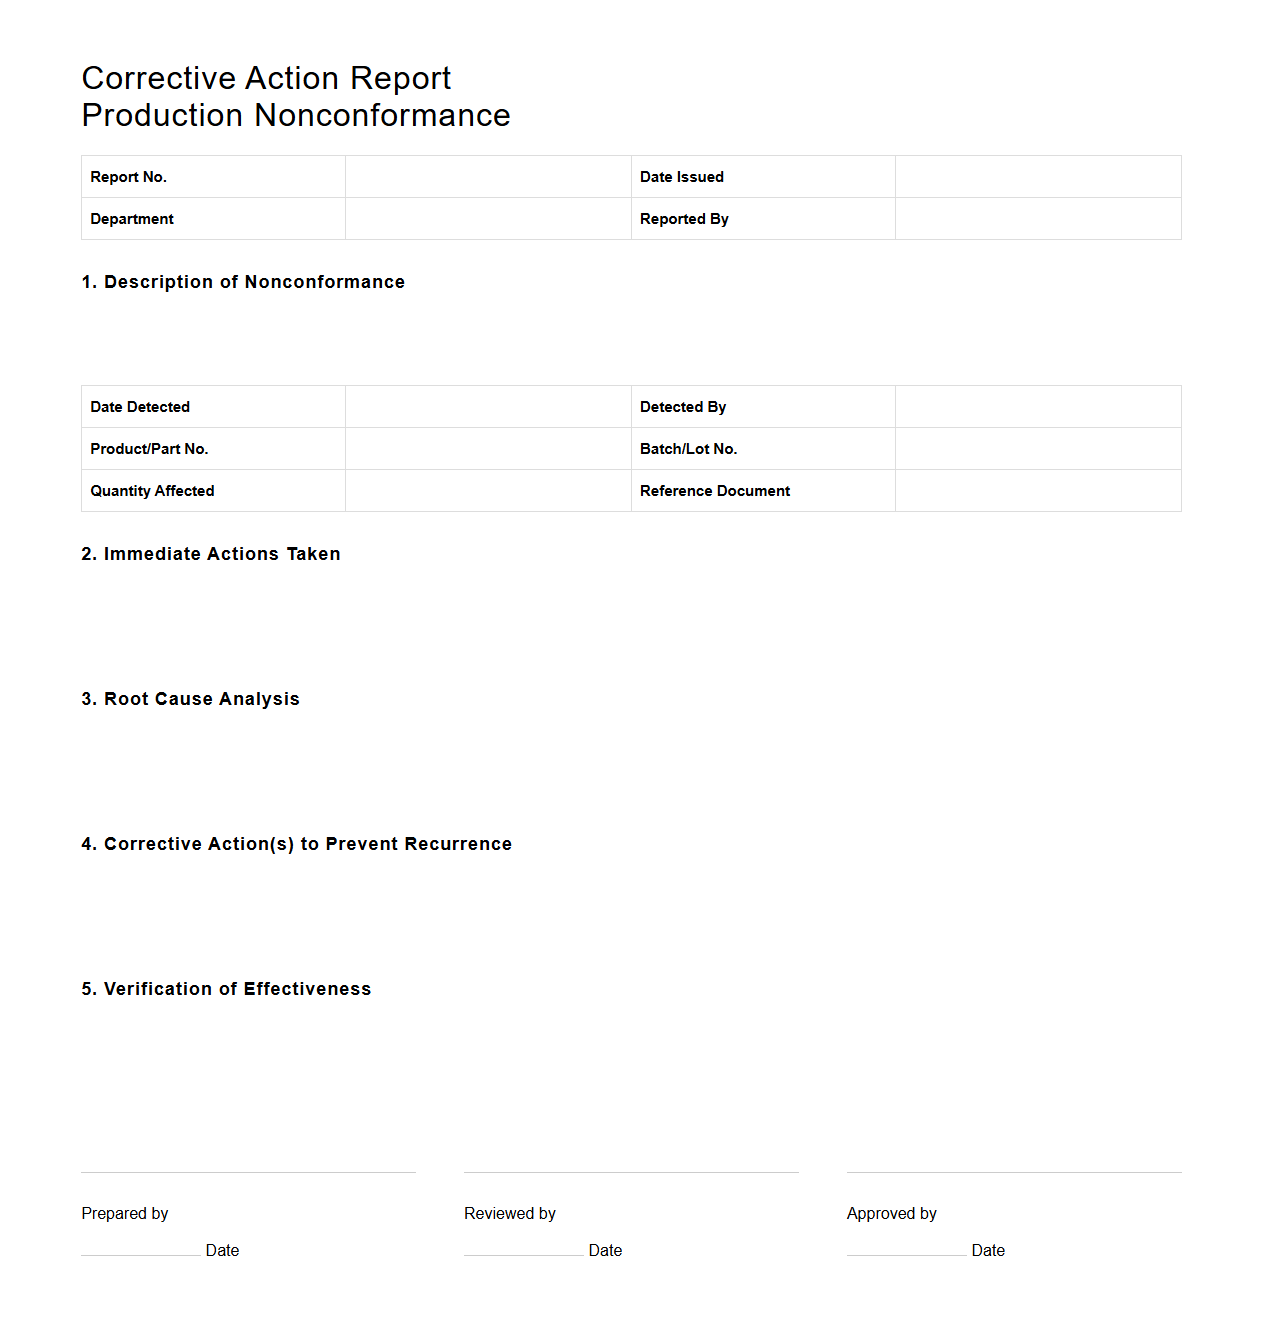
How to interpret forecast variance
Variance is the difference between what was expected and what actually occurred. A useful template should calculate variance consistently and provide a field for interpretation.
A positive variance is not automatically good or bad. The meaning depends on the metric. For defects, a higher-than-expected value may be unfavorable. For completed inspections, a higher value may be favorable if it reflects improved coverage.
Percentage variance can help compare metrics with different scales, but it should not replace absolute values when the underlying volume is important. A small percentage change on a very large workload can still represent a major operational impact.
Variance analysis should distinguish between forecast error and operational change. If production volume changed significantly after the forecast was issued, the original forecast may have been reasonable under its assumptions.
The template should record the reason for material variance. Over time, these explanations become a valuable knowledge base for improving future forecasts and identifying recurring planning weaknesses.
Common mistakes when creating a quality forecast
One common mistake is using too many indicators. A dashboard with dozens of metrics can look comprehensive while making it difficult to identify what actually requires attention.
Another mistake is forecasting counts without considering volume. If activity doubles, a larger number of defects may be expected even if the quality rate has not deteriorated.
Teams also make mistakes when definitions change over time. A defect category that means one thing this year and another thing next year cannot support reliable trend comparisons.
A further problem occurs when forecasts are treated as commitments rather than estimates. Forecasts should support planning and decision-making while clearly communicating uncertainty and assumptions.
Finally, organizations sometimes create a beautiful dashboard without establishing an action process. Every important forecast indicator should have an owner, a threshold, a review frequency, and an expected management response.
Practical Solution
The most practical way to implement a forecast for quality management template is to start with the decisions the forecast needs to support. Do not begin by choosing colors, charts, or spreadsheet layouts. First identify what management needs to know before the next reporting period begins.
Step one is to define three to seven critical quality outcomes. Select measures that directly reflect customer requirements, project acceptance, process performance, compliance, or operational risk. Document the exact definition and calculation method for every measure.
Step two is to build a clean historical dataset. Collect enough periods to reveal meaningful patterns, remove duplicates, standardize categories, and identify unusual events. If the organization is new and has little history, document that limitation rather than creating artificial historical values.
Step three is to identify the drivers of future workload. Record expected production, project milestones, inspection demand, supplier activity, staffing, major changes, and known risks. These drivers should feed the forecast rather than remain as disconnected notes.
Step four is to choose a forecasting method appropriate to the data. A stable process may work with a moving average or weighted trend. A volatile process may benefit from scenario ranges. A high-volume operation may require volume-adjusted rates and workload calculations.
Step five is to establish thresholds before reviewing the next result. Define what counts as acceptable, what requires monitoring, and what requires escalation. Assign an owner and response to each threshold.
Step six is to create a simple workflow: collect data, validate it, update assumptions, calculate the forecast, review exceptions, approve the forecast, communicate actions, and compare actual results against the forecast during the next cycle.
Step seven is to conduct a forecast review. When actual results differ materially from expectations, record the reason. This turns forecast accuracy into an improvement opportunity rather than treating forecasting as a one-time administrative activity.
Step eight is to keep the final dashboard concise. Management should be able to identify the current quality position, expected direction, major risks, and required actions quickly. Detailed records can remain available behind the summary.
Reference Examples
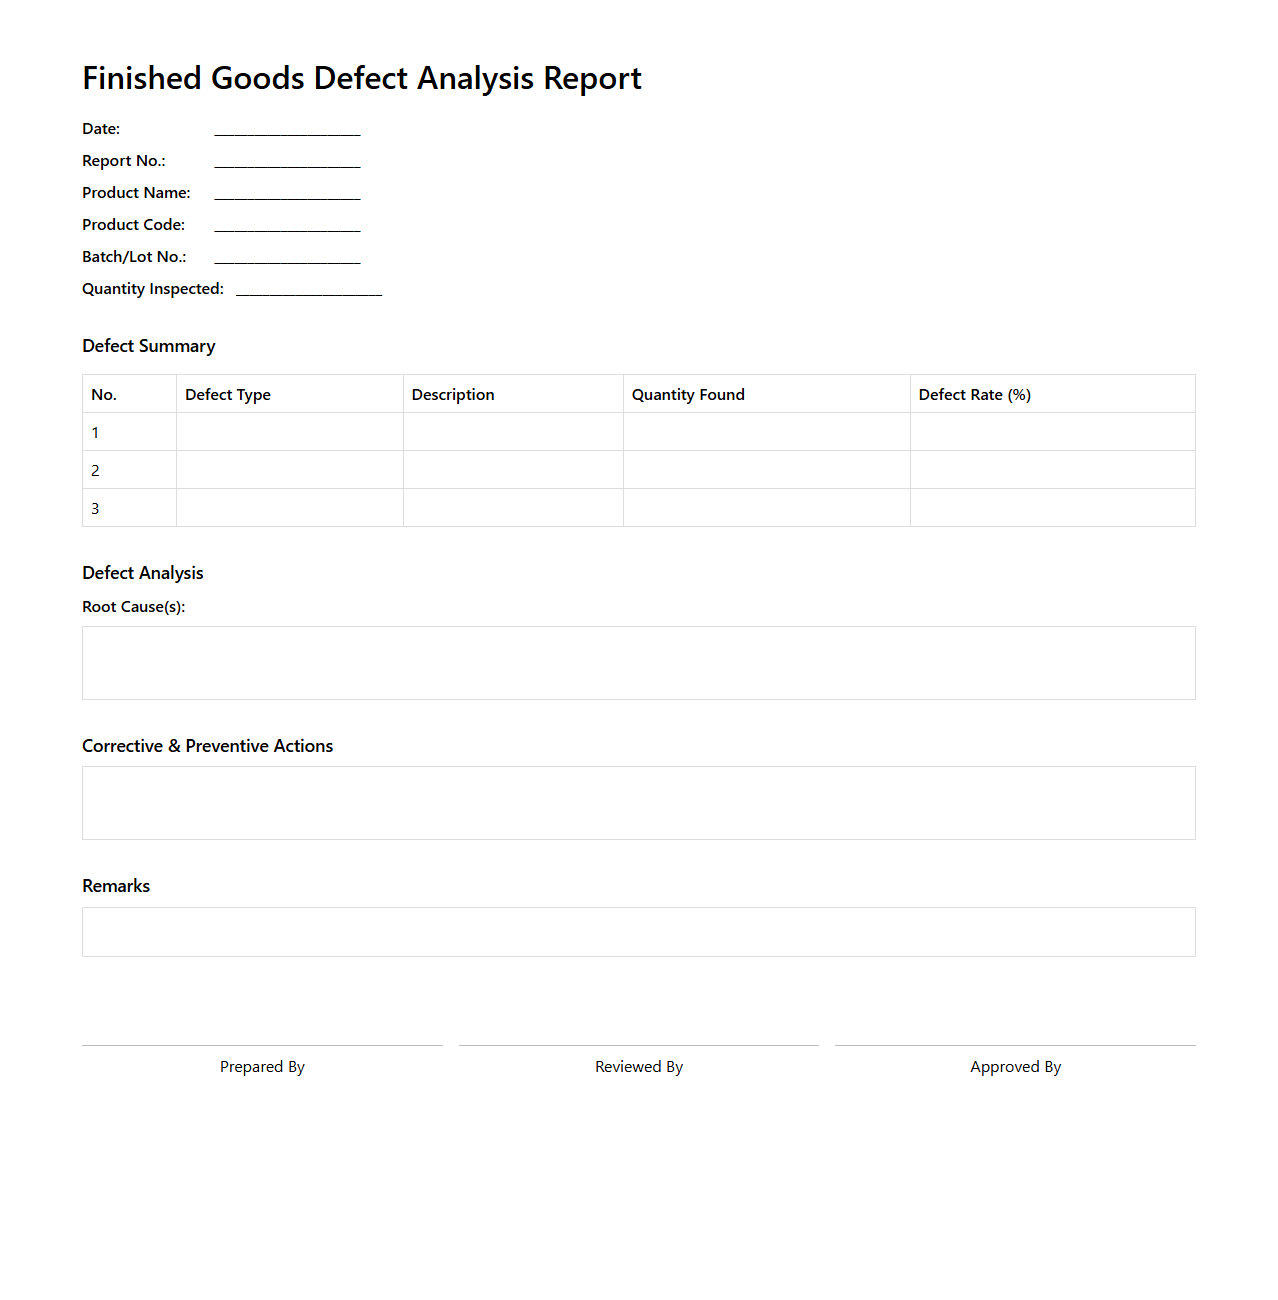
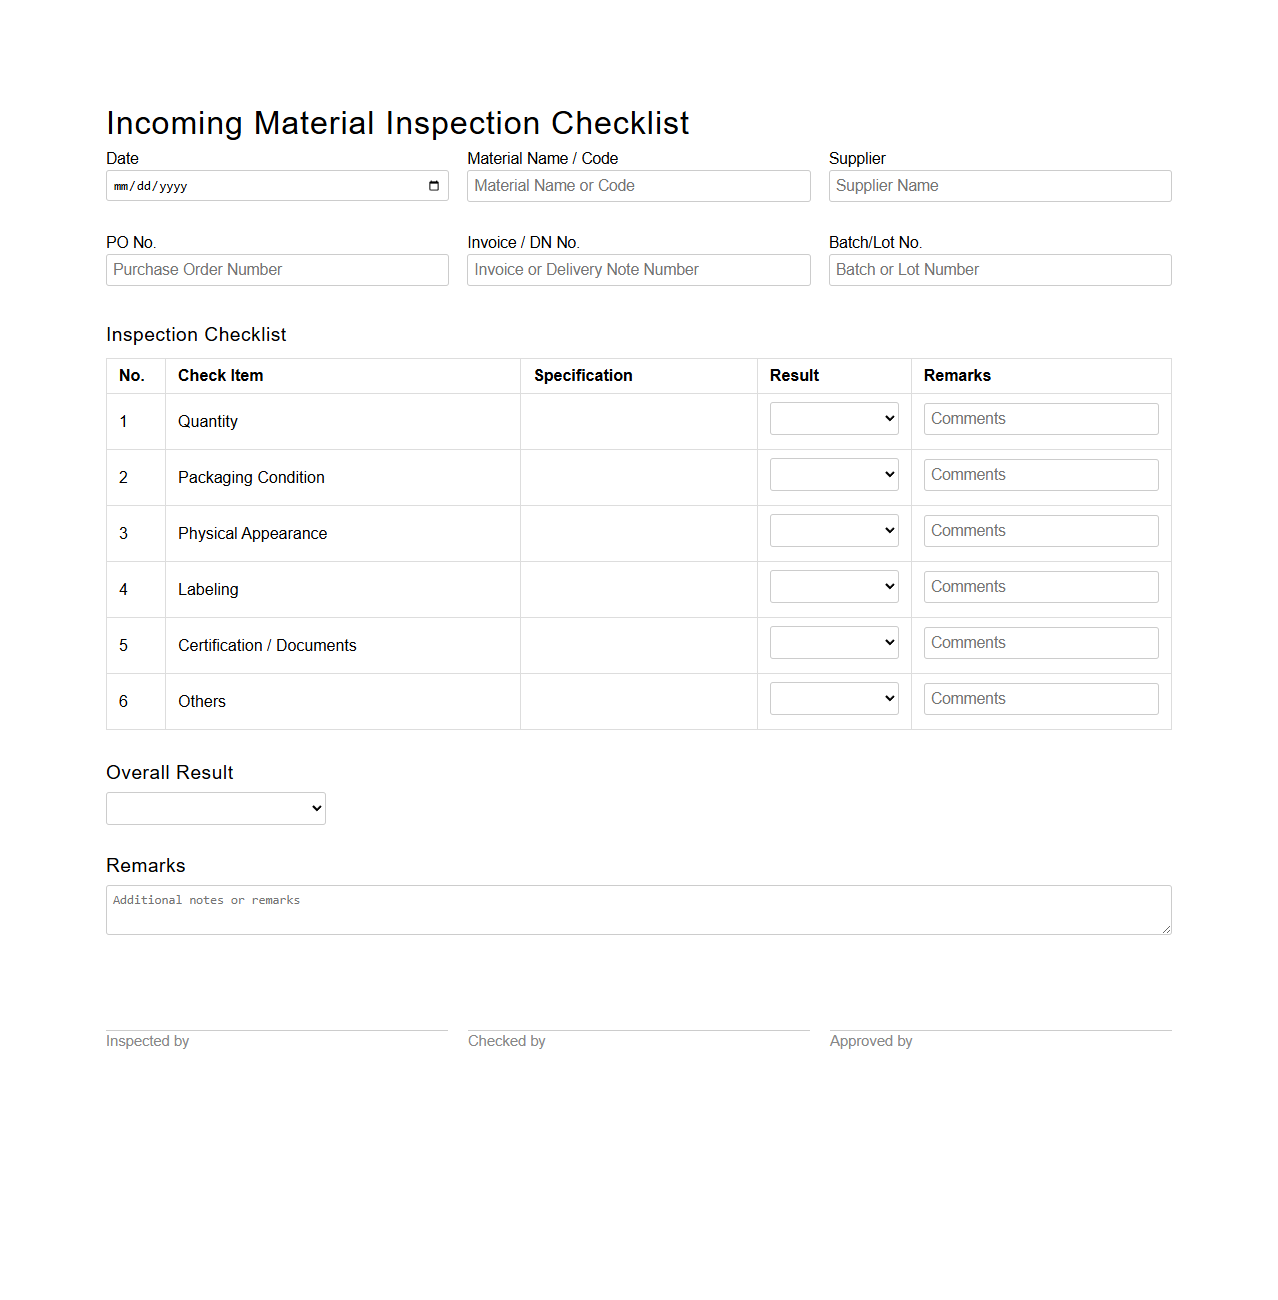
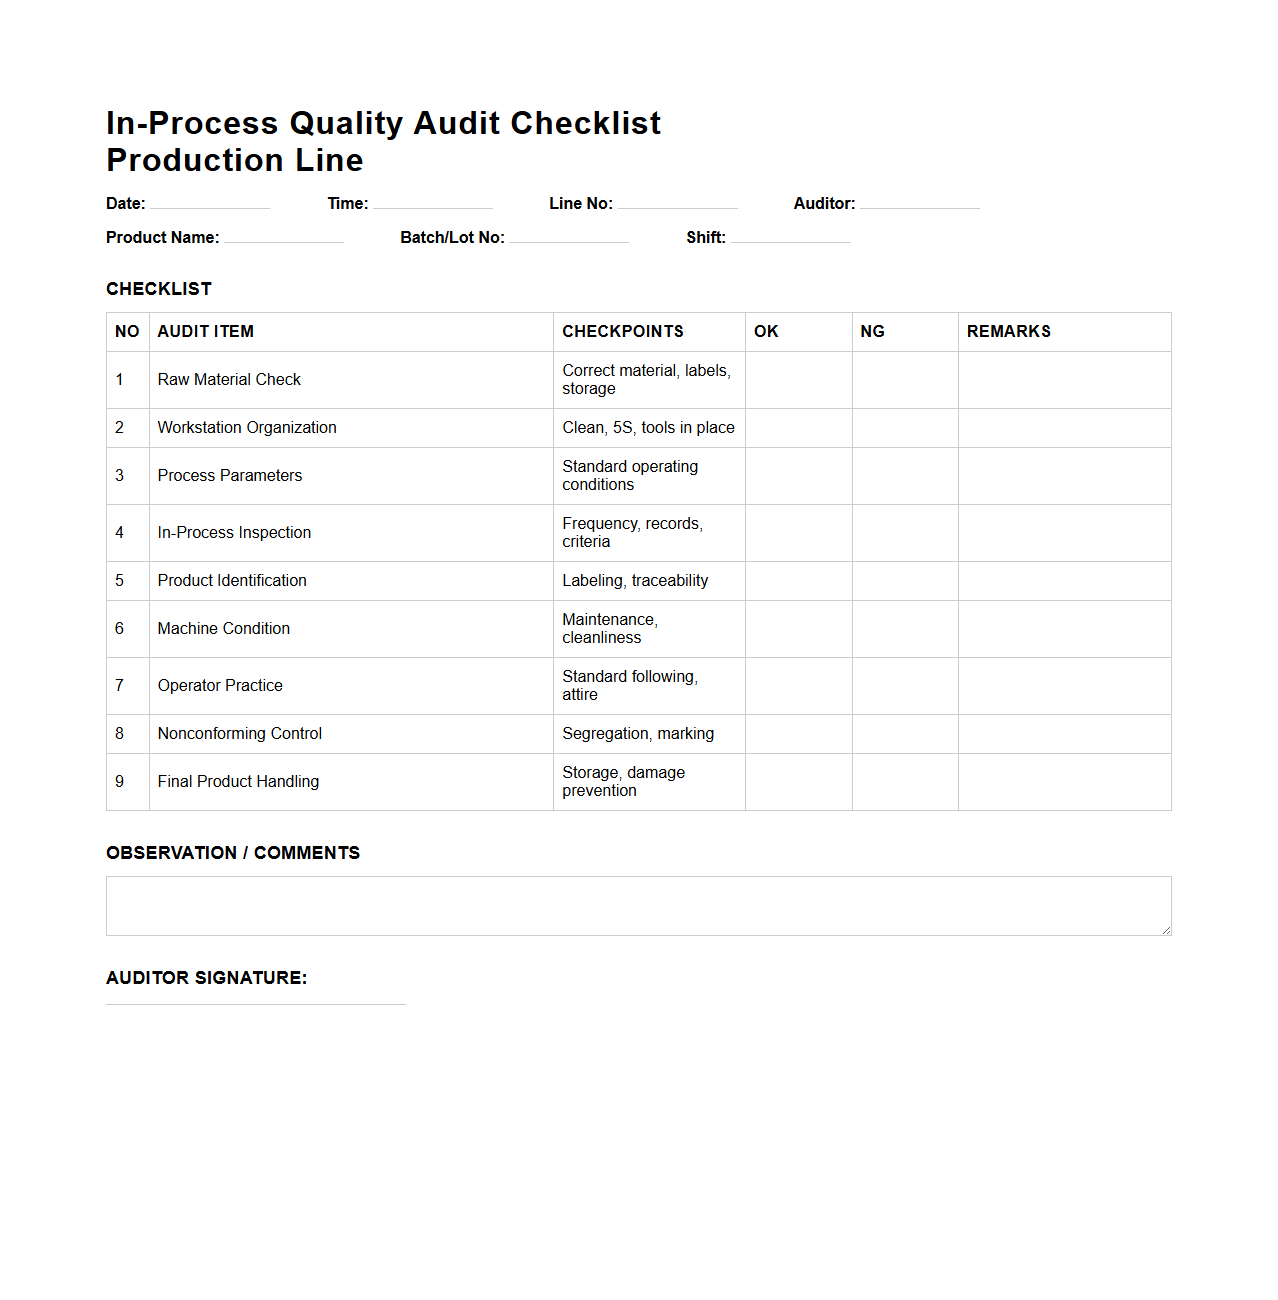
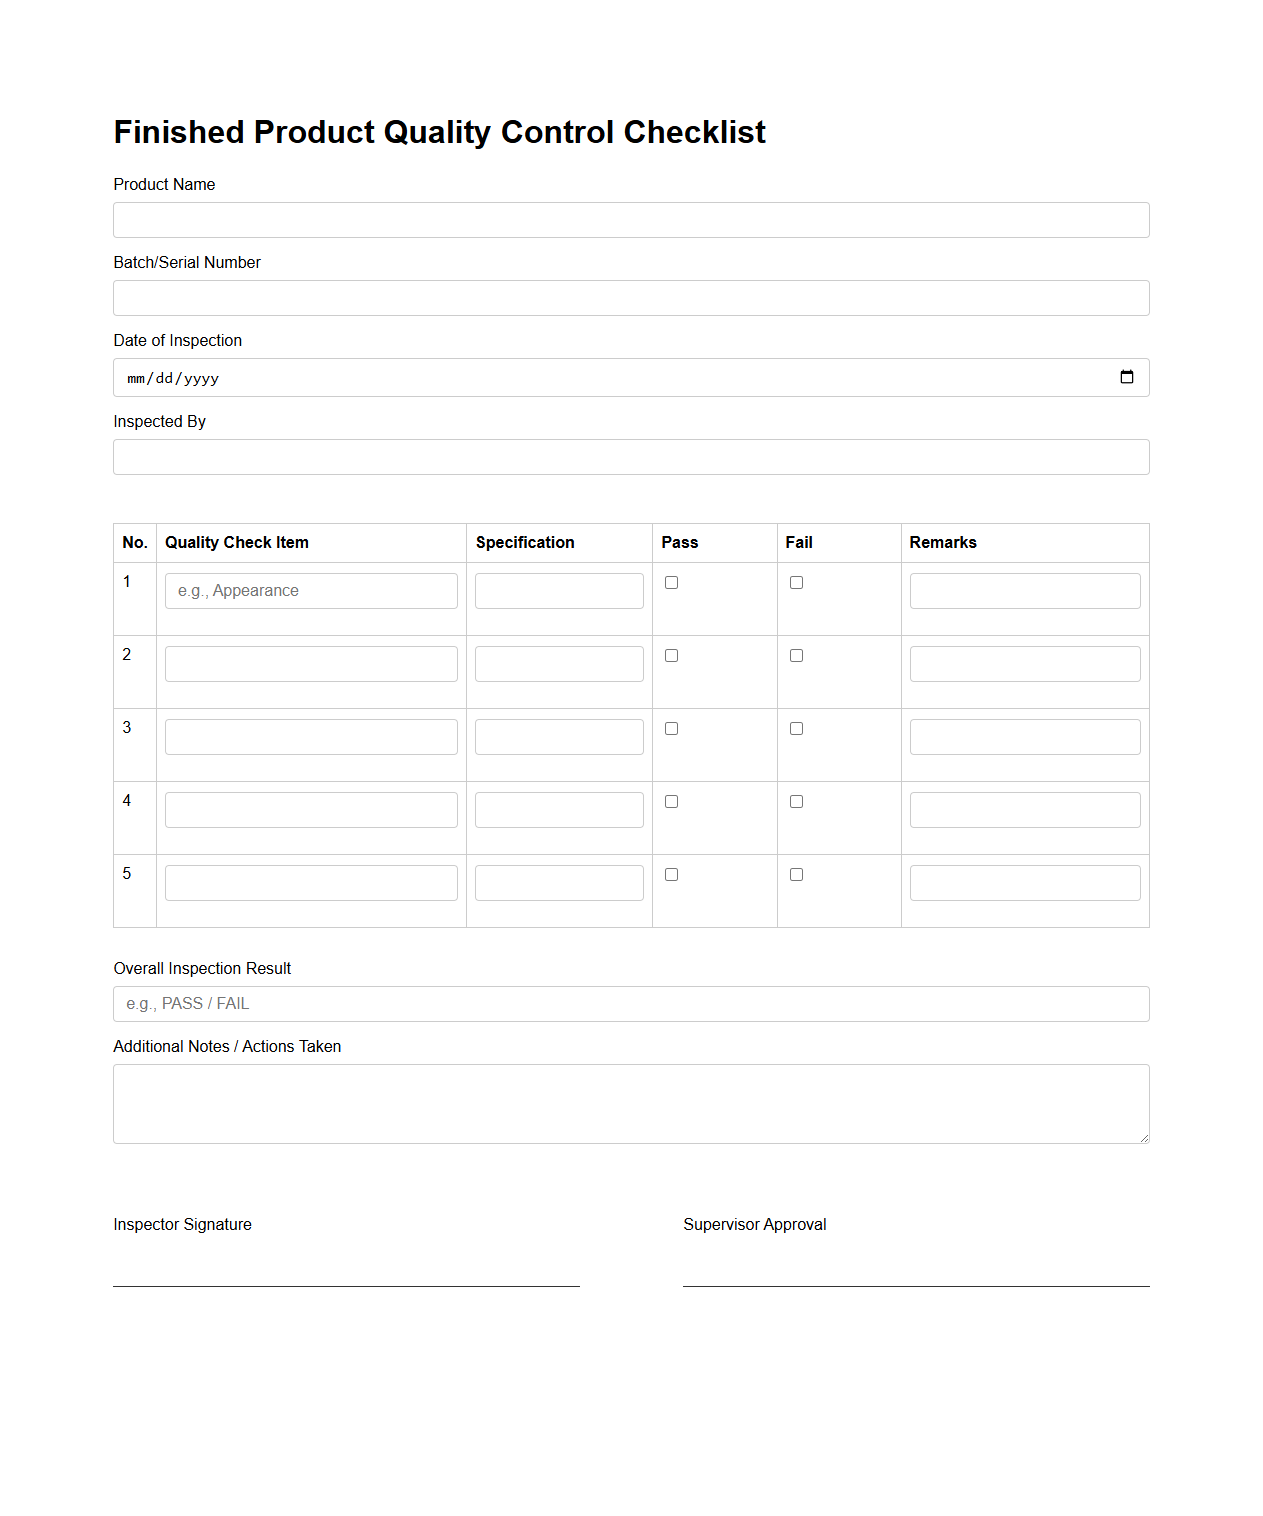
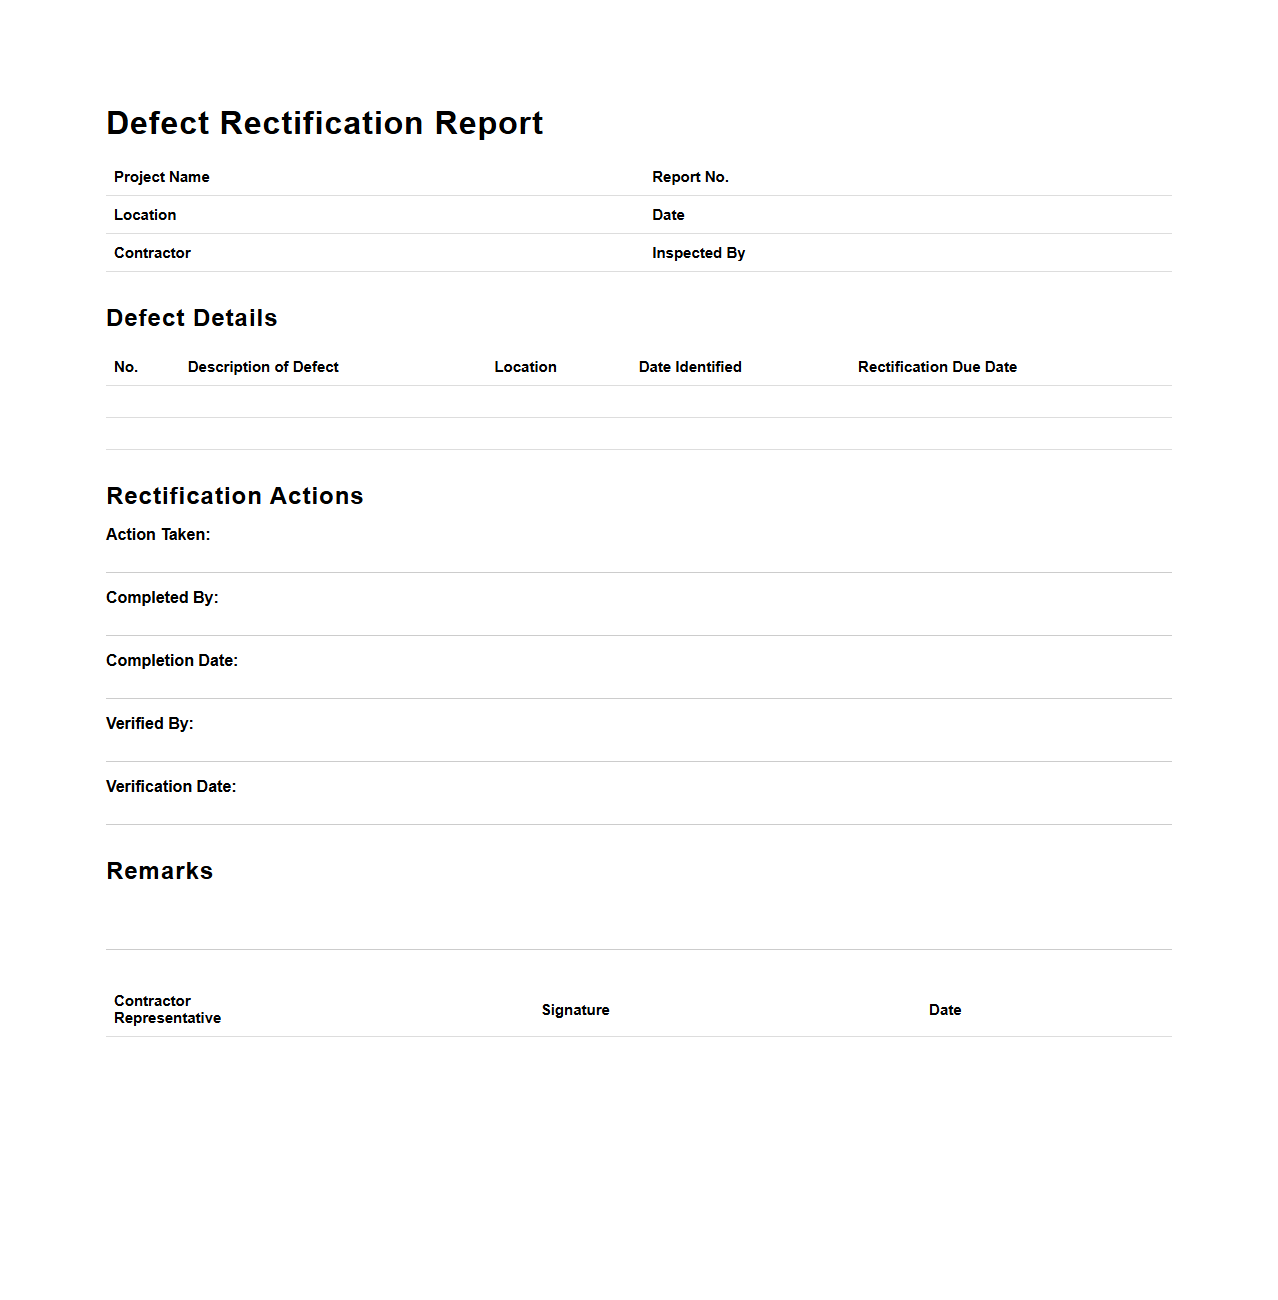
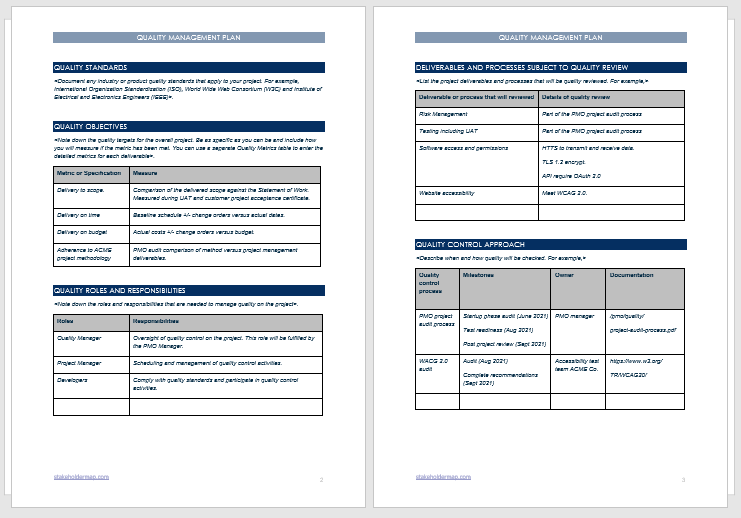
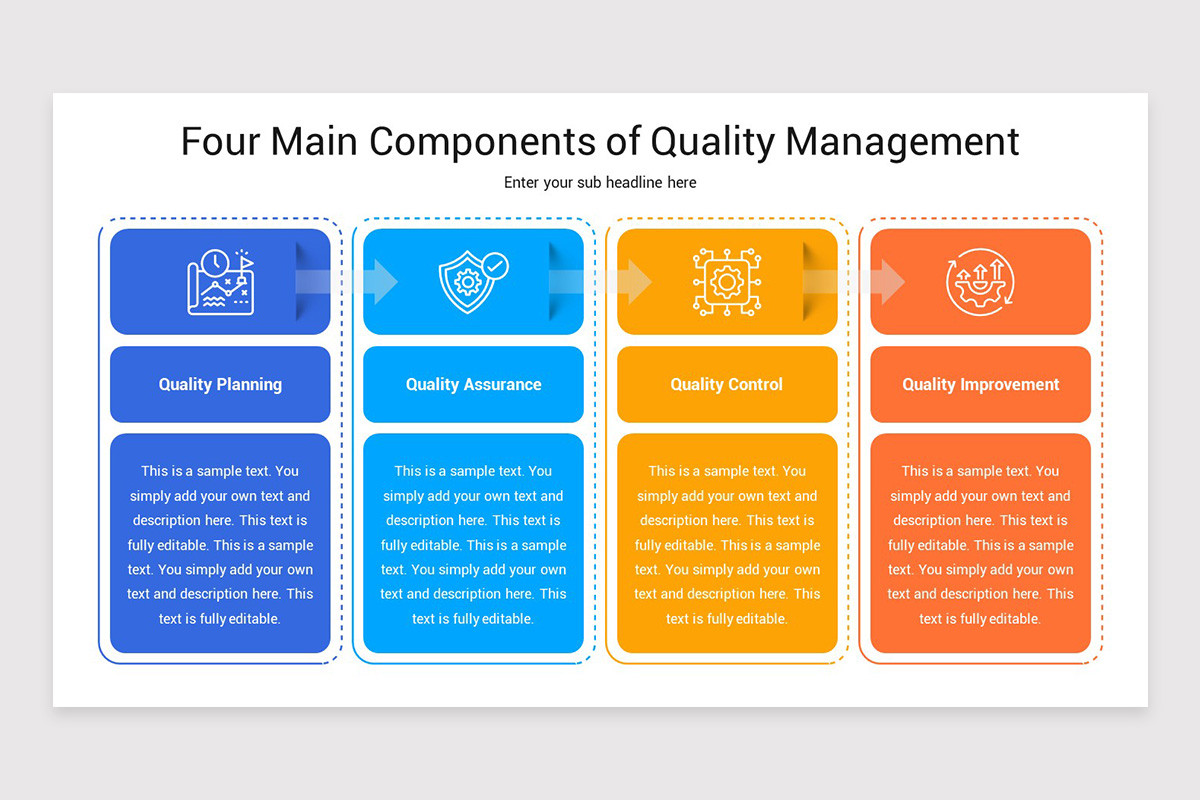
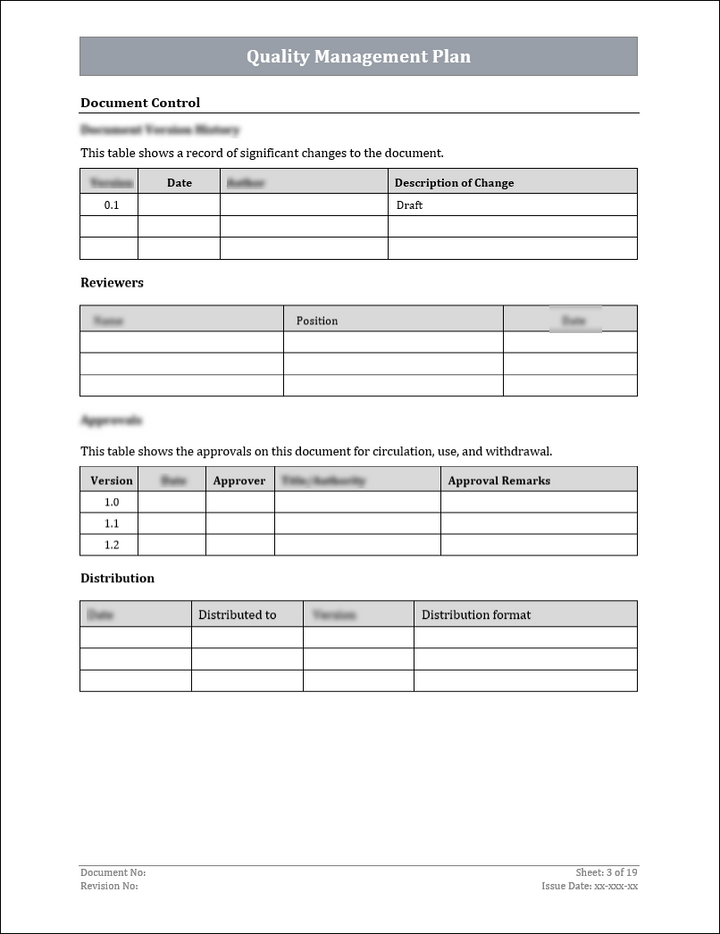
The following examples illustrate different ways quality-management information can be structured across plans, objectives, roles, deliverables, spreadsheets, presentations, dashboards, and inspection documentation. They are reference visuals rather than a claim that every organization should use the same format.
Pforecast for quality management template excel
Source: StakeholderMap
forecast for quality management template free download

Source: StakeholderMap
forecast for quality management template free

Source: StakeholderMap
forecast for quality management template pdf

Source: StakeholderMap
forecast for quality management template google sheets
Source: Nulivo Market
forecast for quality management template excel free

Source: Nulivo Market
forecast for quality management template ppt
Source: ISO Templates and Documents Download
forecast for quality management template word
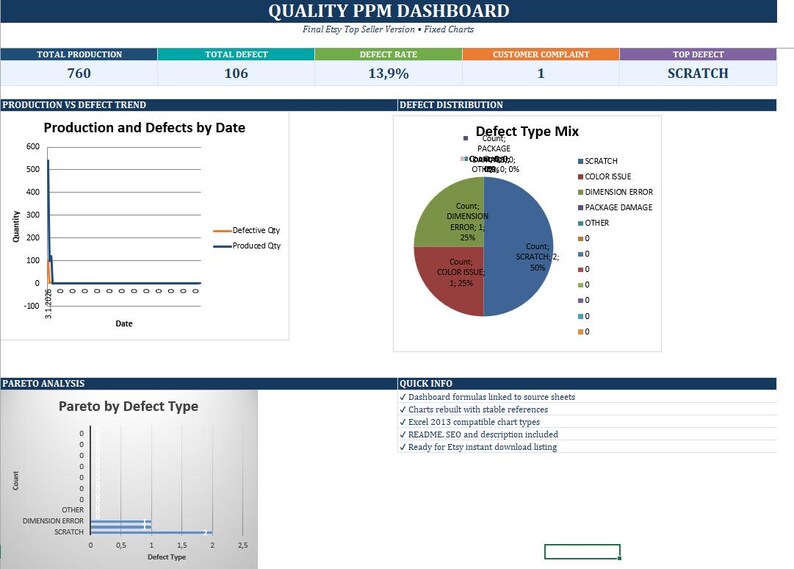
Source: Etsy
forecast for quality management positions
Source: TheGoodocs
quality management program template
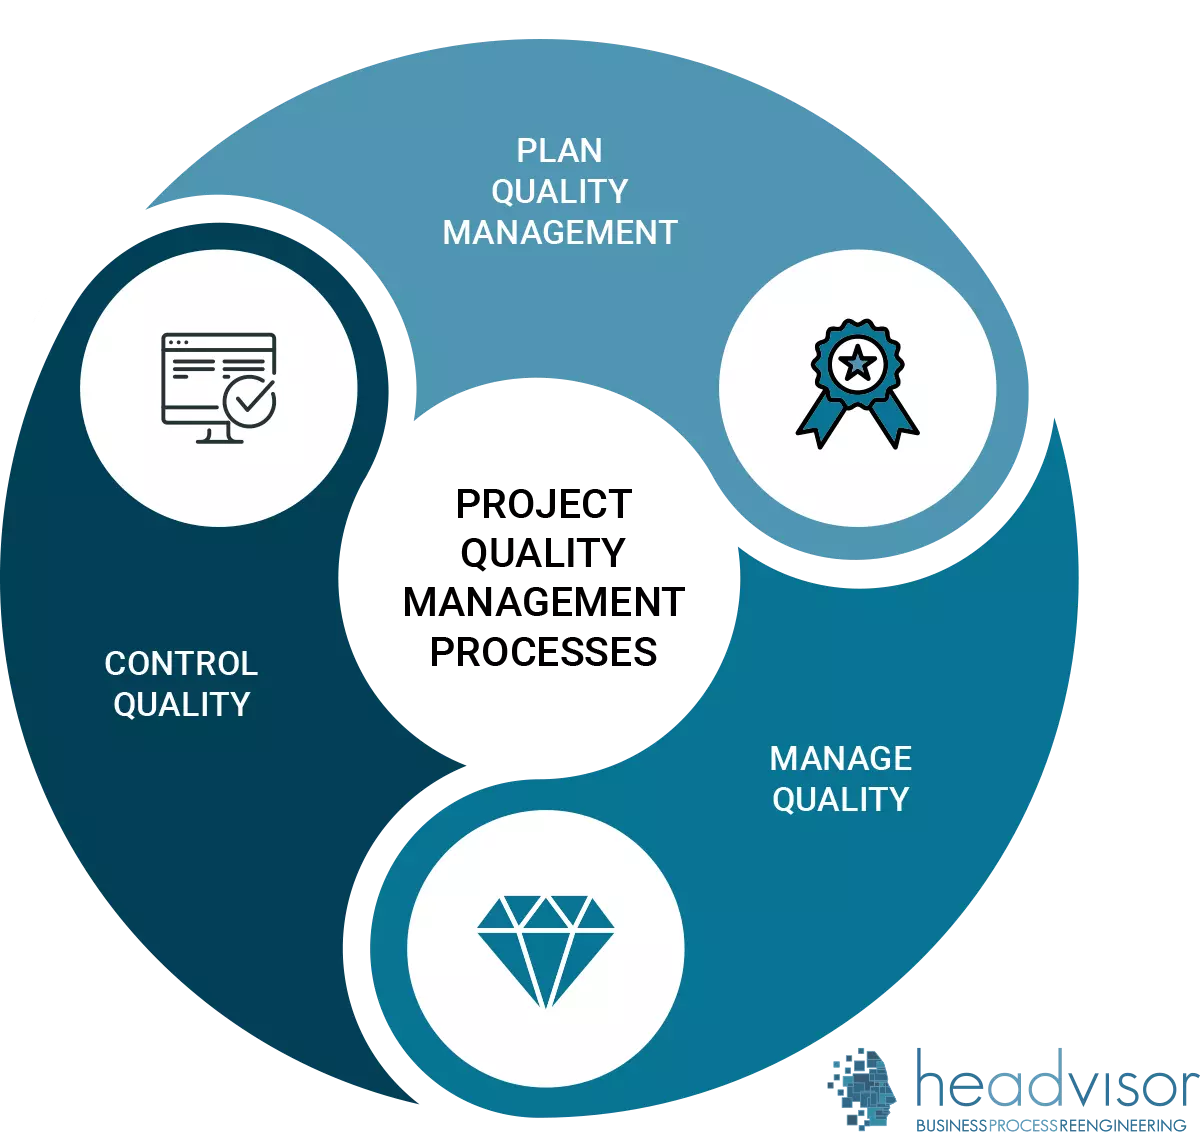
Source: Headvisor
project quality management template
Source: PK: An Excel Expert
monthly quality report template
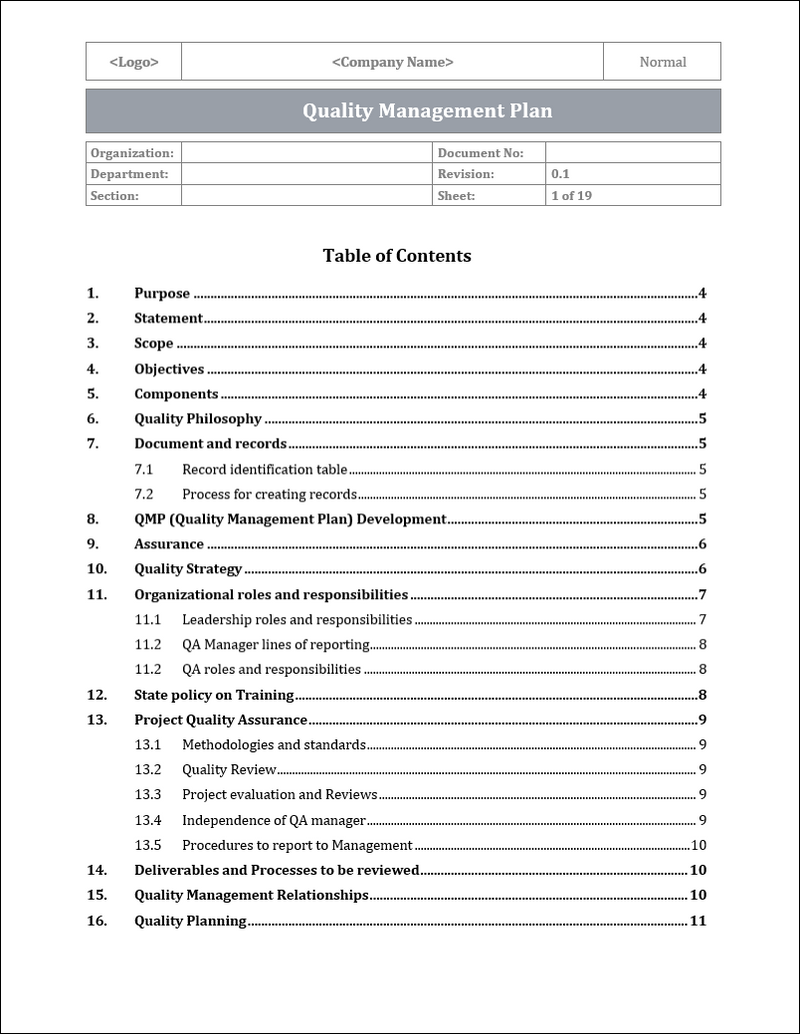
Source: ISO Templates and Documents Download
Frequently Asked Questions
What is the purpose of a forecast for quality management template?
Its purpose is to organize historical data, current conditions, future assumptions, expected quality results, risks, and actions in a consistent format. It helps teams anticipate quality workload and performance rather than relying only on retrospective reports.
Should a quality forecast be monthly or quarterly?
The appropriate frequency depends on how quickly conditions change. Monthly forecasting is useful for many projects and operational teams because it balances timely information with manageable administration. High-risk or high-volume processes may require weekly reviews, while stable programs may use quarterly forecasts.
Can Excel be used for quality forecasting?
Yes. Excel is well suited to structured data, formulas, pivot tables, charts, scenarios, and recurring management reports. A carefully designed workbook can support both detailed records and executive summaries, provided that formulas, definitions, permissions, and version control are managed properly.
What should be included in a quality forecast dashboard?
A useful dashboard normally includes the reporting period, key quality indicators, targets, actual results, forecast values, variances, risk status, major issues, corrective actions, and ownership. The dashboard should focus on decisions and exceptions rather than displaying every available metric.
How is a forecast different from a quality report?
A quality report primarily describes completed or current performance. A forecast estimates expected future performance using available evidence and assumptions. The two should work together: the report explains what happened, while the forecast uses that information to improve future planning.
What is the most important quality forecasting metric?
There is no universal single metric. The most important measure depends on the process and customer requirement. A manufacturing operation may prioritize defect rate or first-pass yield, while a project may prioritize acceptance criteria, unresolved nonconformances, inspection completion, or customer-impacting defects.
How should forecast errors be handled?
Material forecast errors should be investigated without automatically treating them as individual failures. Review the data, assumptions, volume changes, process changes, and unexpected events. Record the explanation and update the forecasting method when the evidence shows that the model or assumptions need improvement.
Conclusion
A practical forecast for quality management template is more than a spreadsheet or reporting form. It is a structured decision-making tool that connects quality objectives, historical evidence, expected workload, risk, resources, performance indicators, corrective actions, and management review. The strongest approach keeps definitions consistent, documents assumptions, separates data from calculations, assigns clear accountability, and uses forecasts as part of a continuous improvement cycle. Whether the final format is Excel, Google Sheets, Word, PDF, or a presentation, the template should make the next quality decision easier, earlier, and better informed.
