The best financial planning analysis template is not simply a spreadsheet filled with formulas. It is a model of how financial information moves from assumptions to forecasts, from forecasts to actual results, and from variances to management decisions. A useful workbook should make assumptions visible, calculations traceable, outputs easy to interpret, and updates straightforward enough to support recurring planning cycles.
Excel remains useful for this purpose because it can combine structured tables, formulas, scenario analysis, charts, financial statements, and management reporting in one environment. Microsoft describes financial management templates for Excel that cover areas such as cash flow statements, income statements, business expense budgets, and personal financial planning, while Microsoft Learn also documents how Excel templates can be connected to structured budget-planning workflows. :contentReference[oaicite:0]{index=0}
This guide explains how to design a financial planning analysis template from the ground up, what information belongs in it, how to connect the major schedules, how to use a five-year planning horizon, and how to turn spreadsheet outputs into practical decisions. It is intended for business owners, finance teams, analysts, FP&A professionals, consultants, and advanced Excel users.
The emphasis is on practical construction rather than decorative formatting. A strong model should answer questions such as how much revenue is expected, which costs are driving the forecast, whether cash is sufficient, how profitability changes under different assumptions, and which performance indicators deserve management attention.

Source: LinkedIn
What Is a Financial Planning Analysis Template?
A financial planning analysis template is a structured workbook used to collect financial assumptions, calculate forecasts, compare planned and actual performance, and present the results in a form that supports decisions. The template can be designed for a household, startup, established company, nonprofit, project, department, or investment plan, although the underlying logic differs according to the user and purpose.
At its simplest, the model connects expected income with expected spending and savings. At a business level, the structure becomes more comprehensive. Revenue drivers feed the income statement, operating assumptions determine costs, working-capital assumptions influence cash, capital expenditure affects assets and cash, financing assumptions affect debt and interest, and the resulting statements produce ratios and KPIs.
The distinction between planning and analysis is important. Planning asks what should happen and what resources will be required. Analysis asks what happened, why it happened, what it means, and what should change. Combining the two functions in one workbook makes the template much more useful because the same assumptions and reporting structure can support both forecasting and performance review.
A template should also distinguish inputs from calculations and outputs. Inputs are assumptions such as units sold, price, headcount, salary growth, tax assumptions, payment terms, capital expenditure, or financing rates. Calculations transform those inputs into projected statements. Outputs summarize the results through tables, ratios, charts, and management commentary.
The value of this structure is consistency. When every planning cycle uses the same definitions, time periods, formulas, and reporting logic, analysts spend less time rebuilding spreadsheets and more time interpreting changes. Microsoft similarly recommends structured Excel templates, formulas, conditional formatting, and charts as practical tools for organizing budget data and highlighting problematic areas. :contentReference[oaicite:1]{index=1}

Source: Wikimedia Commons
Why Use a Financial Planning Analysis Template?
The main reason to use a template is to create a repeatable financial planning process. Without a consistent structure, assumptions can be stored in emails, historical data can sit in accounting exports, and management reports may use different definitions for the same metric. A centralized model provides a common financial language.
A second benefit is visibility. A manager should be able to move from a high-level result to the underlying driver. If projected profit declines, the workbook should make it possible to determine whether the cause is lower volume, weaker pricing, higher labor cost, increased marketing expenditure, financing costs, or another assumption.
A third benefit is scenario planning. A model can contain a base case and alternative cases without requiring the analyst to rebuild the workbook. For example, a company could model different combinations of sales growth, gross margin, staffing levels, and capital expenditure to understand how those changes affect profit and cash.
The template can also strengthen communication. Executives rarely need every underlying transaction, but they need confidence that the numbers are connected. A dashboard showing revenue, gross margin, operating profit, cash, debt, working capital, and selected KPIs can provide a concise view while allowing detailed schedules to remain available for review.
Finally, a template creates an audit trail. Clearly labeled assumptions, standardized formulas, source notes, and version controls make it easier to understand how a forecast was constructed. This becomes particularly important when financial plans are reviewed by senior management, lenders, investors, boards, or external advisers.
Source: Selar
Core Components of a Financial Planning Analysis Template
1. Assumptions and Drivers
The assumptions sheet should be the controlled starting point of the model. Instead of embedding assumptions inside dozens of formulas, place important drivers in clearly labeled cells or tables. Examples include sales volume, average selling price, inflation, wage increases, employee counts, payment terms, tax rates, borrowing rates, and planned investment.
Drivers should be expressed in business terms whenever possible. A sales forecast is more useful when it is based on units multiplied by price rather than a manually typed revenue figure. Similarly, payroll should ideally be connected to headcount and compensation assumptions. This approach makes the model easier to challenge because managers can discuss operational drivers rather than unexplained financial totals.
Each assumption should also have a time dimension. Some assumptions remain constant, while others change monthly, quarterly, or annually. For example, rent might remain stable for a period, while headcount could increase in specific months. The template should allow these patterns without forcing the analyst to manually override formulas.
Good assumptions are also documented. A note can identify whether a figure came from historical actuals, a management target, a contract, a market estimate, or a deliberately conservative planning judgment. Documentation reduces confusion when the model is updated several months after it was originally prepared.
Scenario assumptions should be separated from core historical information. A base case might use management’s central expectation, while upside and downside cases alter selected drivers. This prevents the analyst from accidentally changing historical data while experimenting with future conditions.
Source: BrightAnalytics
2. Revenue Forecast
Revenue is often the most important driver in a financial model, but it should not automatically be treated as a single percentage-growth assumption. A more useful approach identifies the operational mechanisms that create revenue, such as customers, units, transactions, subscriptions, locations, production capacity, or service hours.
For a product business, a simple model might calculate units sold multiplied by average selling price. For a subscription company, the model might separate beginning customers, new customers, churn, average revenue per customer, and expansion revenue. A professional services business might forecast billable staff, utilization, billing rates, and working days.
Historical performance should inform the forecast without mechanically determining it. If revenue increased strongly in the past, that does not necessarily mean the same growth rate will continue. Analysts should consider capacity, pricing, customer concentration, market conditions, seasonality, and planned commercial activity.
The template should also distinguish volume effects from price effects. This makes it easier to explain whether revenue growth is caused by selling more, charging more, changing product mix, or some combination. Such analysis becomes particularly valuable when gross margin changes at the same time.
Finally, revenue should be linked to cash timing where relevant. A business can report growing sales while experiencing cash pressure if customers pay slowly. The planning model therefore needs a bridge between revenue recognition and actual cash collection.

Source: Medium
3. Expense and Cost Planning
Expense planning should separate costs according to how they behave. Variable costs change with activity, fixed costs remain relatively stable within a relevant range, and semi-variable costs contain both elements. Making this distinction helps analysts understand operating leverage.
Cost categories should be detailed enough to support decisions but not so detailed that the model becomes impossible to maintain. Common groups include cost of goods sold, payroll, facilities, technology, marketing, professional services, insurance, administration, travel, depreciation, and financing costs.
Payroll deserves special attention because it can be one of the largest operating expenses. A useful schedule may include employees or roles, starting dates, compensation, benefits, planned hires, departures, and annual increases. The schedule can then feed the income statement automatically.
Operating expenses should also reflect timing. Annual software subscriptions, insurance renewals, bonuses, maintenance programs, and major campaigns can create uneven monthly patterns. A flat monthly allocation may be convenient, but it can distort short-term cash planning.
When possible, connect expenses to operational drivers. Marketing can be tied to campaigns or planned spending, production costs to units, and facilities costs to locations or square footage. Driver-based planning creates a more defensible model than simply applying arbitrary percentage increases to every line.
Source: Docushop
4. Profit and Loss Statement
The projected income statement translates operational assumptions into profitability. At minimum, the structure normally includes revenue, cost of sales, gross profit, operating expenses, operating profit, financing costs, taxes, and net income. More detailed models can include contribution margins, segment profitability, or adjusted measures.
Gross margin is especially useful because it separates changes in revenue from changes in the direct cost structure. If revenue grows but gross margin falls, the business may be gaining sales at an unattractive economic return. If both revenue and gross margin improve, the forecast may indicate stronger operating quality.
Operating profit provides another useful checkpoint. A business may have a healthy gross margin but poor operating profit because overhead is growing too quickly. The model should therefore make it possible to inspect operating expenses by category and compare them with revenue growth.
Taxes and financing costs should be modeled consistently with the assumptions used elsewhere. Interest expense should be linked to debt where practical, while tax calculations should clearly state the assumptions used. The goal is not to create unnecessary complexity but to avoid disconnected figures.
For management reporting, the income statement should usually be available at monthly and annual levels. A five-year view can show the long-term trajectory, while monthly detail provides the operational resolution needed to identify emerging problems.
Source: Etsy
5. Cash Flow Forecast
Profit and cash are related but not identical. A company can be profitable and still experience a cash shortage because of receivables, inventory, capital spending, debt repayments, or other timing differences. That is why cash flow should be a central component of a financial planning analysis template.
A practical cash forecast begins with opening cash and then models operating inflows, operating outflows, investing activity, financing activity, and the resulting closing balance. The detail required depends on the organization, but the model should clearly identify the major cash drivers.
Accounts receivable assumptions are important when customers do not pay immediately. The model can use payment terms or collection patterns to estimate when sales become cash receipts. Accounts payable can be modeled similarly so that supplier costs affect cash according to expected payment timing rather than simply the accounting expense date.
Capital expenditure should also be separated from operating expenditure. A new machine, facility, vehicle, or technology investment can create a substantial cash requirement even if the accounting expense is recognized through depreciation over several years.
Cash forecasting is particularly useful for identifying funding gaps early. If the projected closing balance falls below a management-defined minimum, the model can flag the period and allow the user to test financing, cost reductions, delayed investments, or faster collections.

Source: Wikimedia Commons
6. Balance Sheet Forecast
A balance sheet forecast provides the financial position that sits behind the income statement and cash forecast. It generally organizes assets, liabilities, and equity. The statement should balance in every projected period, which provides an important model integrity check.
Working capital accounts often require the most attention. Receivables can be linked to sales and collection days, inventory can be connected to cost of sales and inventory assumptions, and payables can be connected to purchasing and payment timing. These relationships make the forecast more dynamic and informative.
Fixed assets should reflect planned capital expenditure and depreciation. If the organization plans a major investment, the balance sheet and cash flow should both respond. This is one reason an integrated model is preferable to separate spreadsheets that do not communicate with one another.
Debt should also be integrated. New borrowing increases cash and liabilities, repayments reduce both, and interest affects profit and cash. A debt schedule can therefore become a useful supporting schedule that feeds multiple financial statements.
Equity may include retained earnings, contributed capital, distributions, or other relevant components. The exact structure depends on the organization, but the underlying principle is the same: the balance sheet should reconcile logically with the other statements.

Source: Wikimedia Commons
Using a 5-Year Financial Planning Horizon
A five-year horizon is long enough to show structural changes while remaining practical for many business planning situations. It can help management visualize expected growth, investment requirements, financing needs, and profitability rather than focusing only on the next budget cycle.
A five-year model should not imply that every future number can be predicted accurately. Long-range planning is better understood as a structured set of assumptions and scenarios. The further the forecast extends, the more important it becomes to focus on drivers, ranges, and relationships rather than false precision.
The first year can contain greater monthly detail because near-term actions are more concrete. Later years can be modeled annually or quarterly when appropriate. This approach balances operational usefulness with long-term strategic visibility.
Long-term planning should include major investment decisions, expected financing needs, workforce development, capacity changes, pricing strategy, and other structural factors. A business that plans to double production capacity, for example, may need additional capital expenditure, employees, working capital, and financing well before the expected revenue increase occurs.
A five-year plan should also be reviewed periodically. New actual results, revised commercial plans, changes in costs, financing conditions, and strategic decisions can make old assumptions obsolete. A rolling planning process can therefore be more useful than treating the original five-year forecast as permanent.

Source: Wikimedia Commons
Building the Excel Workbook Structure
A practical workbook can be divided into clearly defined tabs. One common structure includes an instructions or cover sheet, assumptions, historical actuals, revenue drivers, headcount, operating expenses, capital expenditure, working capital, debt, income statement, balance sheet, cash flow, KPIs, scenarios, and dashboard.
Inputs should be visually distinguishable from formulas. Color coding can help, but it should not be the only control. Labels, cell protection, consistent number formats, and clear section headers can make the workbook easier to use for people with different levels of Excel expertise.
Historical data should generally be kept separate from forecast periods. This reduces the risk of overwriting actual results when assumptions change. It also makes variance analysis easier because actual and forecast values have clear origins.
Formula consistency is more important than formula complexity. A sophisticated model with inconsistent formulas can be less reliable than a simple model with transparent calculations. Analysts should avoid unnecessary hardcoding, unexplained manual overrides, and formulas that depend on hidden assumptions.
Control checks should be built into the workbook. Useful checks include balance sheet balance, cash roll-forward, beginning-to-ending retained earnings reconciliation, debt roll-forward, scenario selection, and completeness of required inputs.

Source: Wikimedia Commons
Financial Planning Analysis Template: Data Collection and Research
Reliable financial planning begins with reliable inputs. Historical financial statements are usually the starting point, but the analyst should also understand operational information behind the accounting numbers. Revenue by product, customer, region, or channel can reveal patterns that are invisible in a single total.
Expense data should be reviewed for unusual items before historical trends are used as forecasting assumptions. A one-time legal fee, major repair, restructuring cost, or unusual bonus should not automatically become a recurring annual expense.
Operational interviews can provide information that accounting records cannot. Sales leaders may know about pipeline changes, operations managers may know about capacity constraints, and human resources may know about planned hiring. The template should capture these business drivers where they materially affect the forecast.
External research can be useful for scenario assumptions, but assumptions should be labeled according to their source and confidence. A management target, historical trend, contractual commitment, and external estimate should not be treated as equally certain.
Data governance is especially important when multiple people contribute to the model. Definitions should be agreed in advance. For example, the organization should establish what counts as revenue, operating expense, active customer, headcount, or adjusted EBITDA before those measures become dashboard KPIs.

Source: Wikimedia Commons
Scenario Analysis and Sensitivity Testing
Scenario analysis tests different combinations of assumptions. A simple structure may contain base, upside, and downside cases. More advanced models can allow users to change individual drivers such as price, volume, margin, staffing, capital expenditure, or financing costs.
The base case should represent the central planning assumption rather than the most optimistic outcome. An upside case can reflect stronger sales or better margins, while a downside case can reflect weaker demand, higher costs, delayed collections, or other realistic pressures.
Sensitivity analysis is narrower than scenario analysis. It changes one or two variables to show how strongly an output responds. For example, an analyst could test how operating profit changes when revenue growth moves through several levels while costs remain constant.
The most useful sensitivities focus on variables management can influence or variables that create meaningful financial risk. There is little value in testing dozens of irrelevant assumptions if the result is a complicated dashboard that no one uses.
Scenario outputs should include both profitability and liquidity. A scenario may generate attractive profit while consuming significant cash, or it may protect cash by reducing investment at the expense of future growth. Decision-makers need to see these trade-offs rather than a single headline metric.

Source: Wikimedia Commons
Financial KPI and Variance Analysis
Key performance indicators turn the financial model into a management tool. The appropriate KPIs depend on the business, but common financial measures include revenue growth, gross margin, operating margin, EBITDA margin, net margin, cash conversion, working capital, debt ratios, return measures, and budget variance.
KPIs should have clear definitions. A metric should specify its numerator, denominator, period, and data source. Without consistent definitions, two departments can report different values for what appears to be the same KPI.
Variance analysis compares actual results with a defined benchmark. The benchmark may be budget, forecast, prior year, target, or another reference point. The purpose is not merely to display a difference but to explain why the difference occurred.
A useful variance report separates price, volume, mix, timing, and other drivers where practical. For example, a revenue variance may result from fewer units sold, while gross margin variance may result from higher material costs. This turns reporting into a diagnostic process.
Dashboards should avoid overwhelming users with too many metrics. A smaller group of clearly defined KPIs is often more useful than a screen containing every ratio available in the workbook.

Source: Wikimedia Commons
Working Capital Analysis
Working capital can significantly affect cash requirements even when reported profit remains stable. The template should therefore track receivables, inventory, payables, and other relevant operating balances rather than focusing only on the income statement.
Receivables can be modeled using collection days or historical payment patterns. If sales increase while customers take longer to pay, cash may grow more slowly than revenue. This relationship should be visible in the forecast rather than discovered after a cash shortage occurs.
Inventory planning is equally important for product businesses. Excess inventory can consume cash and create obsolescence risk, while insufficient inventory can constrain sales. The appropriate model may connect inventory requirements to expected sales, production cycles, or purchasing lead times.
Payables can provide some natural financing because suppliers may allow payment after goods or services are received. However, extending payment assumptions without considering commercial relationships can make the model unrealistic.
A strong financial planning analysis template can translate working-capital assumptions into a cash impact. This allows management to compare the cost of growth with the cash required to support that growth.

Source: Wikimedia Commons
Capital Expenditure and Investment Planning
Capital expenditure should be modeled separately because its financial effects extend beyond the month in which cash is paid. A major investment can increase fixed assets, depreciation, financing requirements, and future operating capacity.
A capital expenditure schedule should identify the project or asset, expected purchase period, cash cost, useful life, depreciation approach, and expected operational benefit where practical. This information helps management compare investment timing with expected returns.
Investment decisions should also consider opportunity cost. Spending cash on one project may reduce the organization’s ability to finance another project, repay debt, or maintain a desired liquidity reserve.
For long-term planning, capital expenditure should be connected to strategic objectives. Capacity expansion, automation, technology modernization, and facility upgrades may have different financial profiles even when their upfront costs appear similar.
The model should make investment assumptions easy to change. If a project is delayed by six months, the user should be able to shift the timing without manually rebuilding the cash flow and depreciation schedules.

Source: Wikimedia Commons
Debt, Financing, and Funding Requirements
Financing assumptions can materially change a financial forecast. A debt schedule should generally show opening balance, new borrowing, repayments, interest, and closing balance. These figures should flow into the balance sheet, cash flow, and income statement.
Interest assumptions should reflect the structure of the borrowing where possible. A fixed-rate facility behaves differently from variable-rate debt, and different repayment schedules can create substantially different cash requirements.
Funding requirements should be identified before cash reaches a critical level. The model can establish a minimum cash threshold and calculate the potential funding gap under different scenarios.
Analysts should also consider covenant or financing constraints when relevant. If a lender requires certain ratios, the planning model can monitor those measures and highlight periods in which projected performance may create pressure.
The purpose is not to predict financing with perfect certainty. It is to give decision-makers enough visibility to act before a liquidity problem becomes urgent.

Source: Wikimedia Commons
How to Read the Model as a Decision-Making Tool
Reading a financial model begins with the headline outputs, but the analyst should quickly move toward the drivers behind those outputs. A revenue forecast should lead to questions about customers, pricing, volume, and capacity. A margin change should lead to questions about product mix and cost structure.
The next step is to examine cash. If profit rises but cash falls, the model should explain the difference through working capital, investment, debt repayment, or another item. This is often where a connected model provides more insight than a standalone profit forecast.
After reviewing cash, management should examine the balance sheet and key ratios. Rising debt, falling liquidity, or increasing receivables may signal risks that are not immediately visible in the income statement.
Scenario analysis then helps determine whether the plan is resilient. If a small deterioration in sales causes a severe liquidity problem, the business may need additional reserves, financing flexibility, cost controls, or a different investment schedule.
The final step is to translate findings into actions. A financial model becomes valuable when its results influence pricing, hiring, spending, investment, financing, inventory, collections, or strategic priorities.

Source: Wikimedia Commons
Practical Example: A Small Business Forecast
Consider a hypothetical small business that sells a specialized product. Management expects unit sales to increase over the next several years, but the business also plans to hire additional staff and purchase production equipment. The financial planning analysis template should connect these decisions rather than treating each one as an isolated entry.
The revenue schedule could begin with projected units and average price. If the example assumes 10,000 units at an average selling price of $40, projected revenue would be $400,000. If units rise to 12,000 while price increases to $42, the model would show $504,000 of projected revenue for that period.
The cost schedule could then estimate materials per unit, direct labor, and variable production costs. Fixed expenses such as rent, administration, software, and insurance would be modeled separately. This makes it easier to understand how much of the additional revenue becomes contribution margin.
The equipment investment would enter the capital expenditure schedule and cash flow forecast. Depreciation would affect the income statement, while the purchase itself would affect cash and fixed assets. If financing is used, the debt schedule would also change.
The resulting dashboard might show revenue, gross margin, operating profit, cash, debt, and working capital. Because the example is hypothetical, its numbers should be treated only as an illustration of model structure rather than as a prediction or industry benchmark.

Source: Wikimedia Commons
Common Mistakes to Avoid
One common mistake is building a visually attractive workbook with weak underlying logic. A dashboard can look professional while still containing hardcoded numbers, disconnected schedules, inconsistent definitions, or formulas that do not reconcile.
Another mistake is excessive detail. More rows do not automatically produce better analysis. If a category cannot influence a decision and requires substantial maintenance, it may belong in supporting accounting data rather than the core planning model.
Hardcoding forecast outputs is another major risk. When a forecast number is typed directly into a statement rather than calculated from a driver, the model becomes harder to update and less transparent.
Analysts should also avoid mixing historical actuals with forecast assumptions without clear labels. This can make it difficult to determine whether a change represents a real performance shift or merely a revised expectation.
Finally, do not confuse precision with accuracy. A forecast containing amounts to the nearest dollar is not necessarily more reliable than one using rounded figures. The quality of the assumptions and relationships matters more than unnecessary numerical detail.

Source: Wikimedia Commons
Best Practices for Professional Financial Models
Use a consistent structure throughout the workbook. Inputs, calculations, checks, statements, KPIs, and dashboards should each have an identifiable purpose. Users should not have to search through unrelated tabs to determine where a number originated.
Keep formulas simple enough to audit. Complex formulas can be appropriate, but they should be used when they genuinely improve the model. Breaking complicated calculations into supporting schedules can make the workbook easier to review.
Document important assumptions. A short note describing the source, rationale, date, and owner of an assumption can prevent future confusion. This is particularly useful when forecasts are updated by different analysts.
Use checks throughout the model. A balance sheet check, cash reconciliation, debt roll-forward check, and scenario-control check can catch errors before the workbook is presented to decision-makers.
Review the model regularly. A financial plan should evolve as actual performance becomes available. Microsoft notes that Excel financial templates can be updated and reused, while structured budgeting templates can also use formulas, conditional formatting, pivot tables, and charts to support ongoing analysis. :contentReference[oaicite:2]{index=2}
Source: Wikimedia Commons
Practical Solution
Start by defining the decisions the financial planning analysis template must support. If the primary goal is annual budgeting, prioritize budget versus actual analysis. If the goal is fundraising or investment planning, emphasize long-term projections, cash requirements, scenarios, and funding assumptions.
Next, collect at least the historical financial information needed to establish a credible baseline. Reconcile revenue, costs, cash, debt, assets, liabilities, and equity before building future periods. Historical data should be clean enough that unusual transactions can be identified rather than blindly repeated.
Build the model in layers. Begin with assumptions and operational drivers, then create supporting schedules, then connect the three financial statements, and finally build KPIs and dashboards. This sequence reduces the temptation to create presentation outputs before the underlying calculations are reliable.
Use a base case as the central plan and add alternative scenarios only for variables that materially affect decisions. Review revenue, margins, working capital, capital expenditure, debt, and cash under each scenario. Record the management action associated with each significant risk or opportunity.
Establish a recurring review process. Each reporting cycle should update actual results, compare them with the previous forecast, explain significant variances, refresh assumptions, and determine whether the strategic plan still makes sense. The workbook should become a living management tool rather than a document created once and forgotten.

Source: Wikimedia Commons
Reference Examples
The following reference examples illustrate the types of spreadsheets, dashboards, and planning layouts that can help readers understand the structure of a financial planning analysis template. They are visual references rather than claims that a particular format is mandatory.
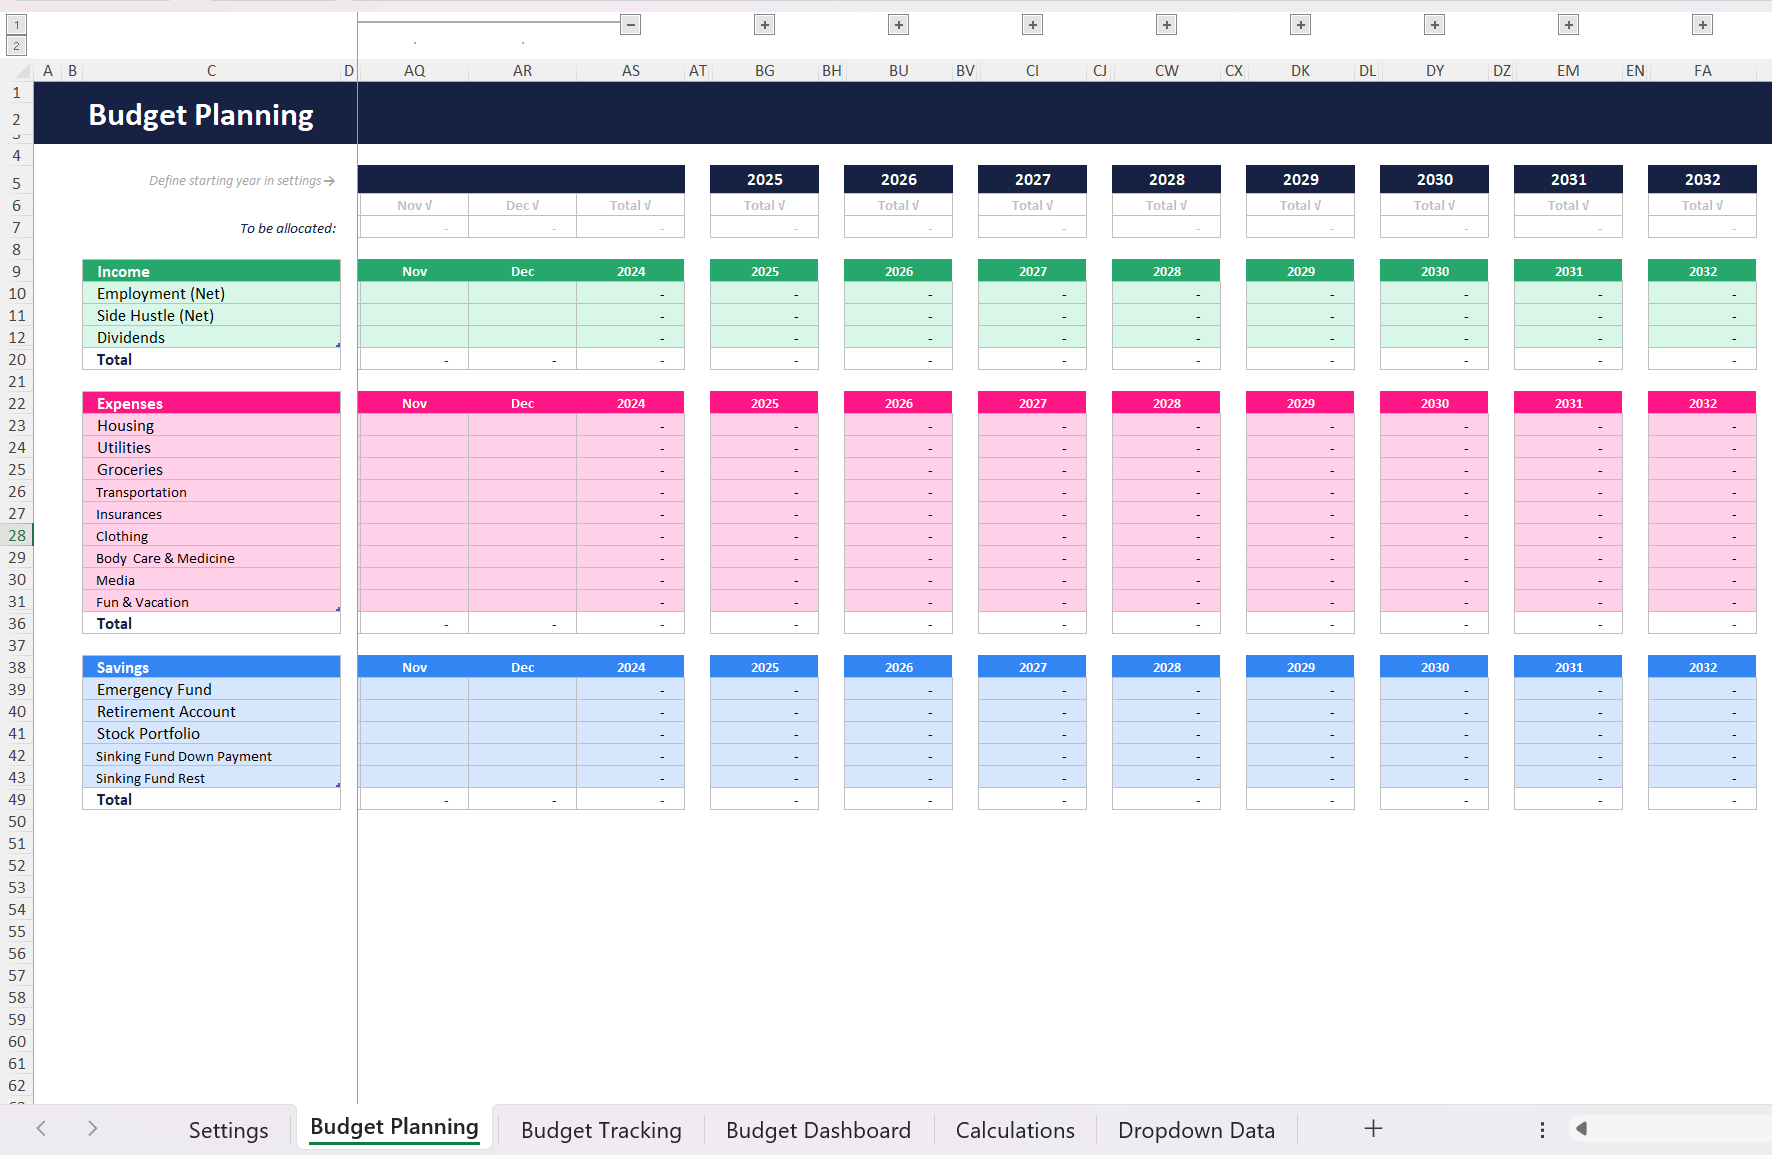
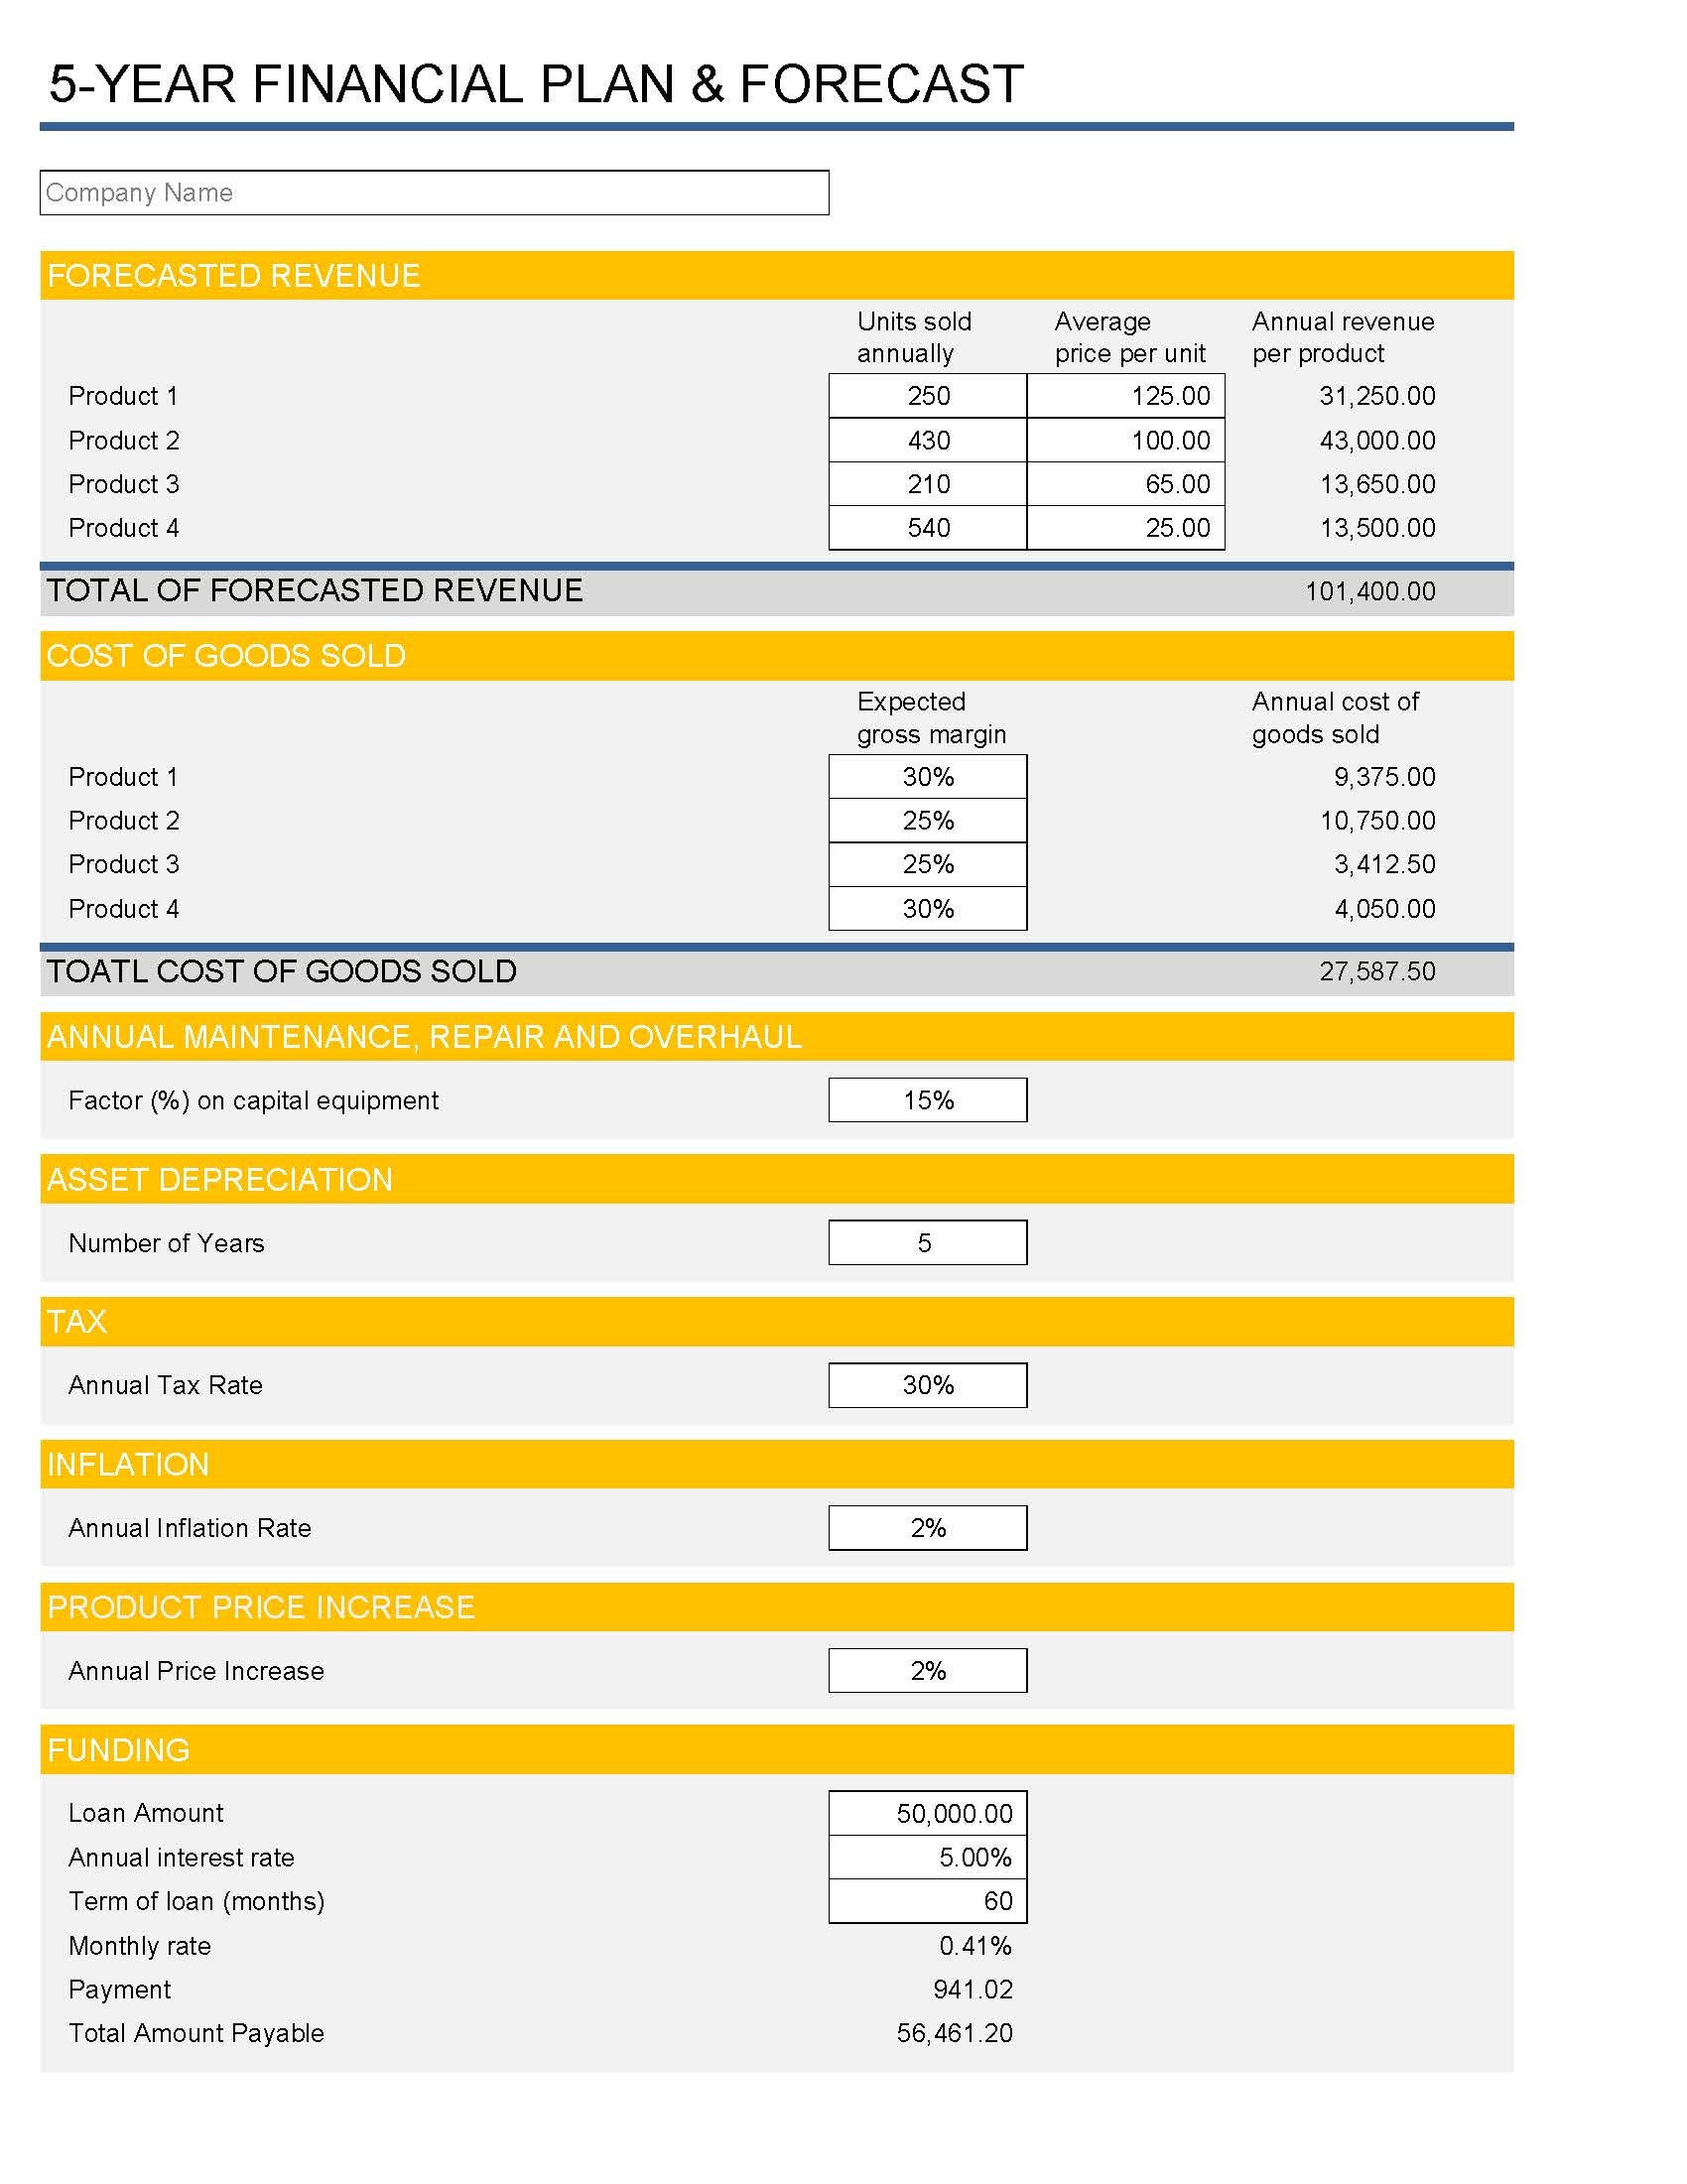
5 year financial planning template excel
Source: Docushop
financial planning plan template excel
Source: Selar
fp&a excel templates
Source: LinkedIn
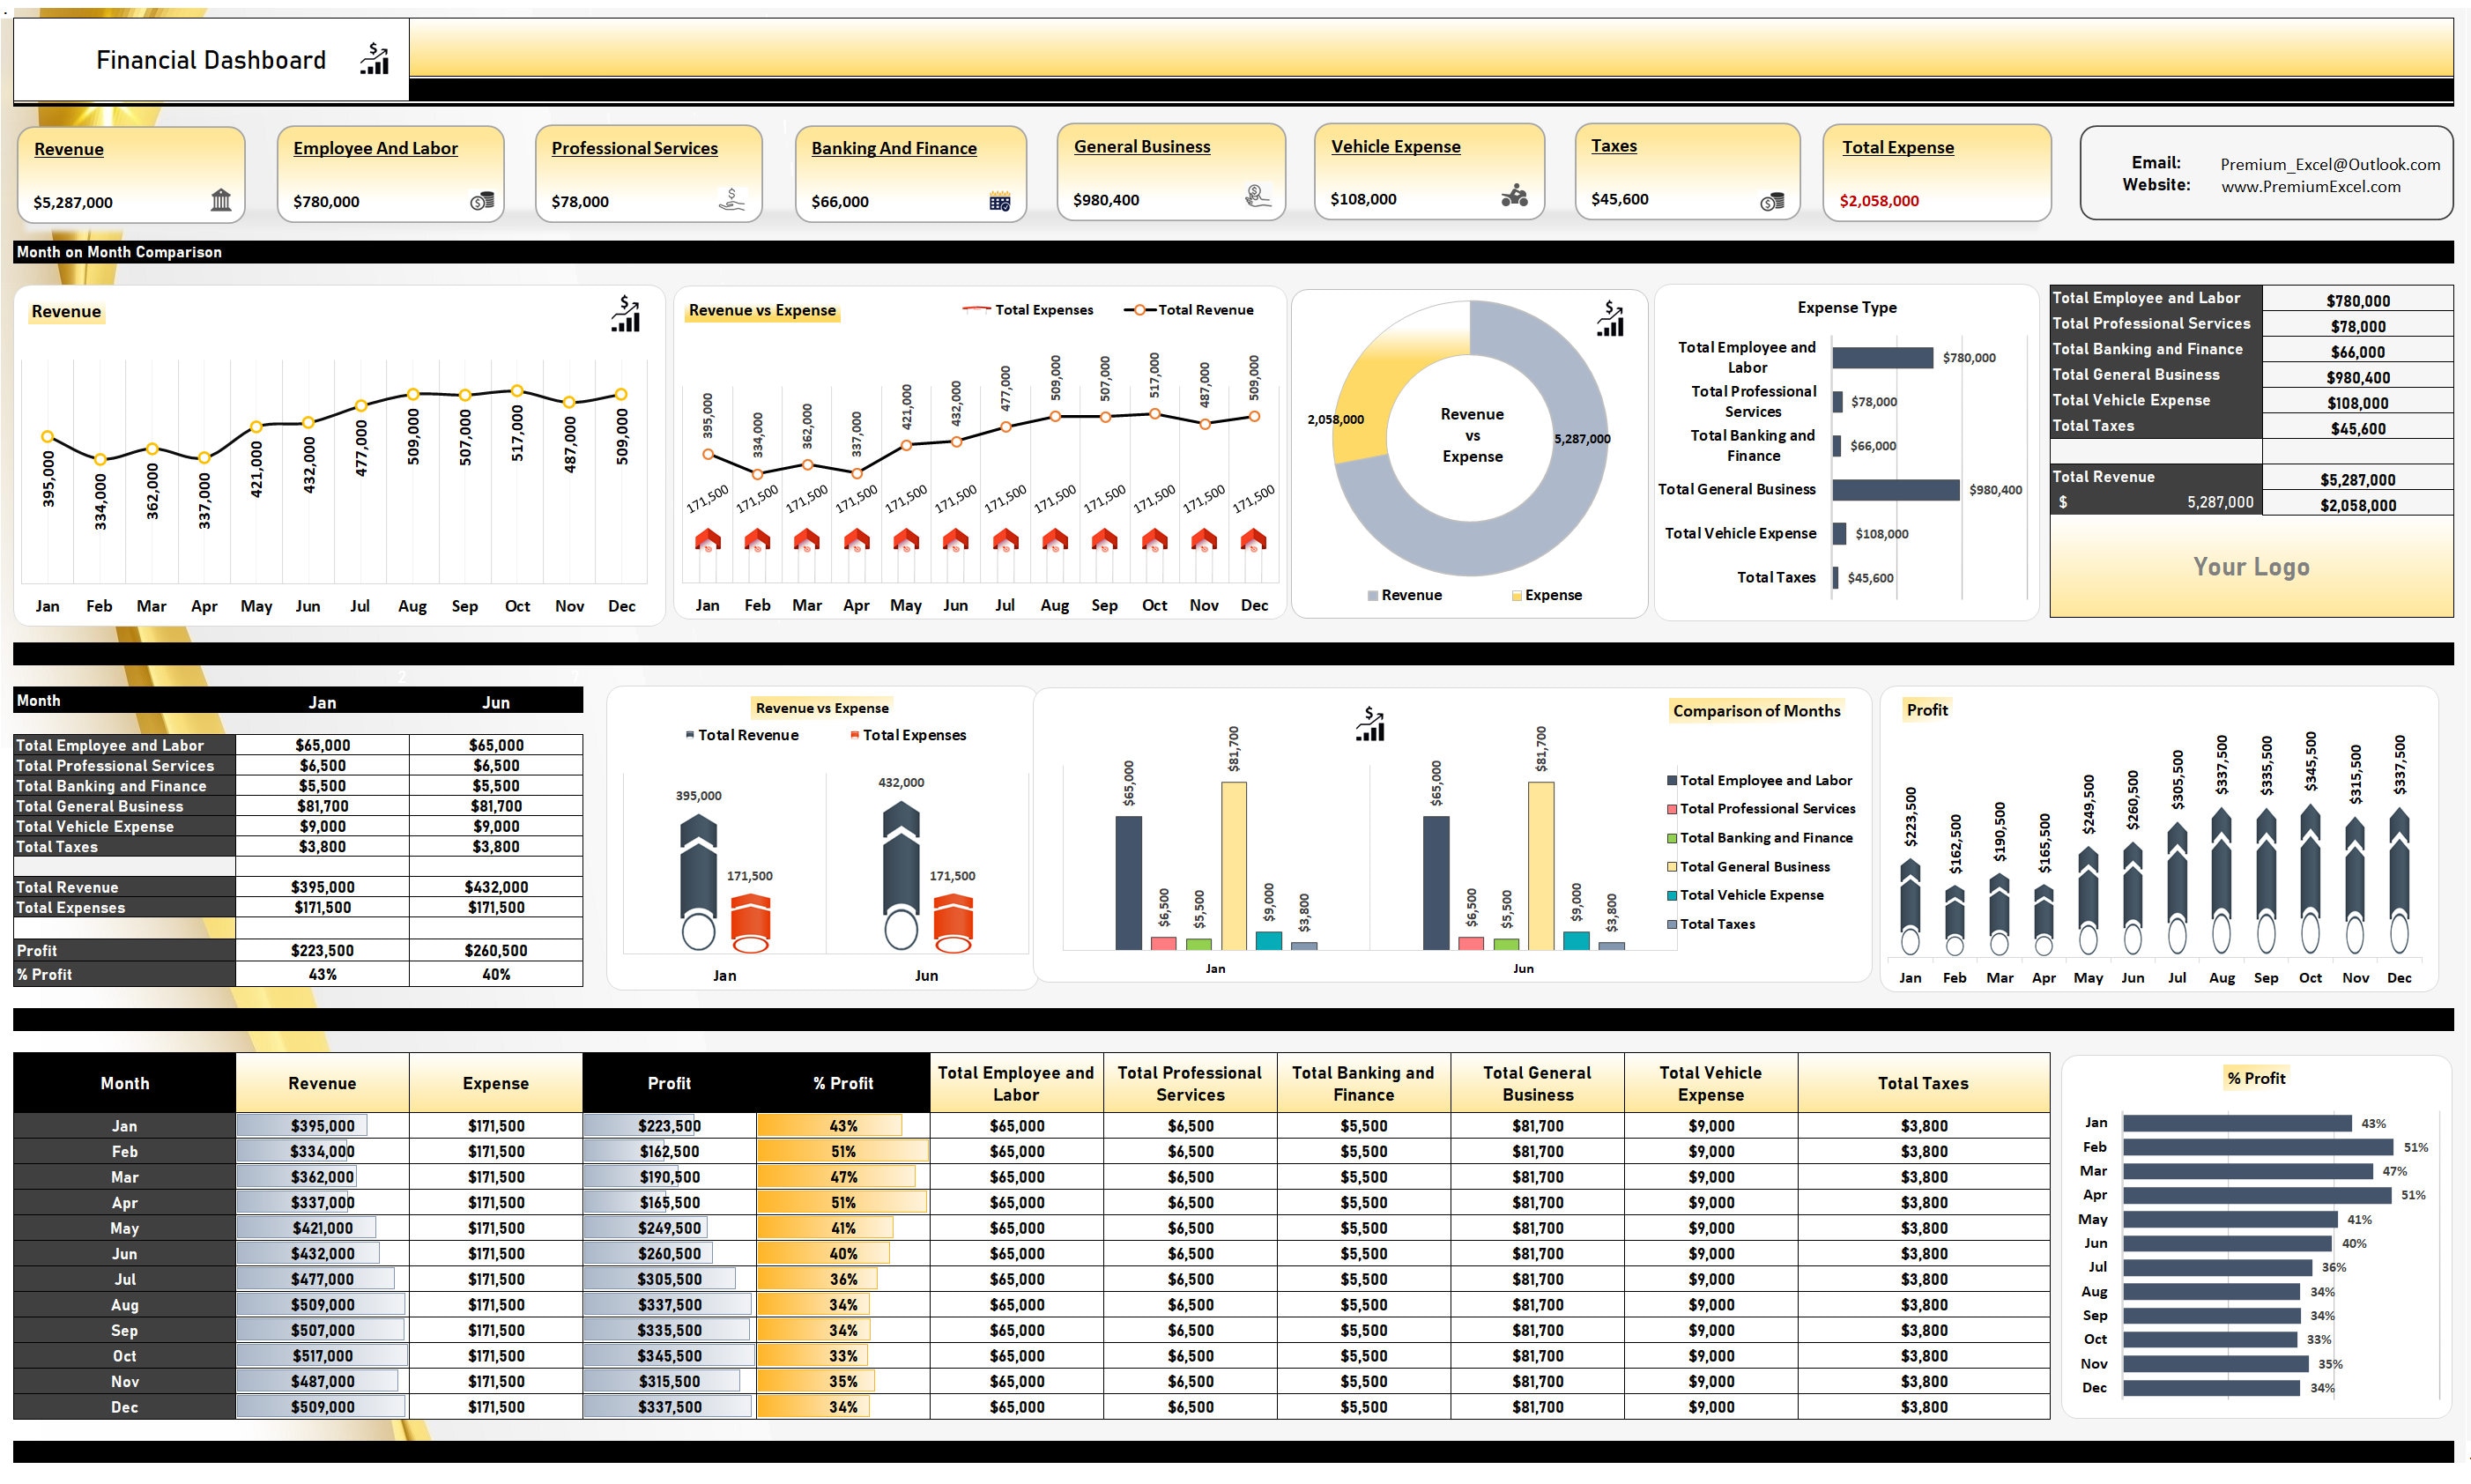
financial kpi template excel
Source: Etsy
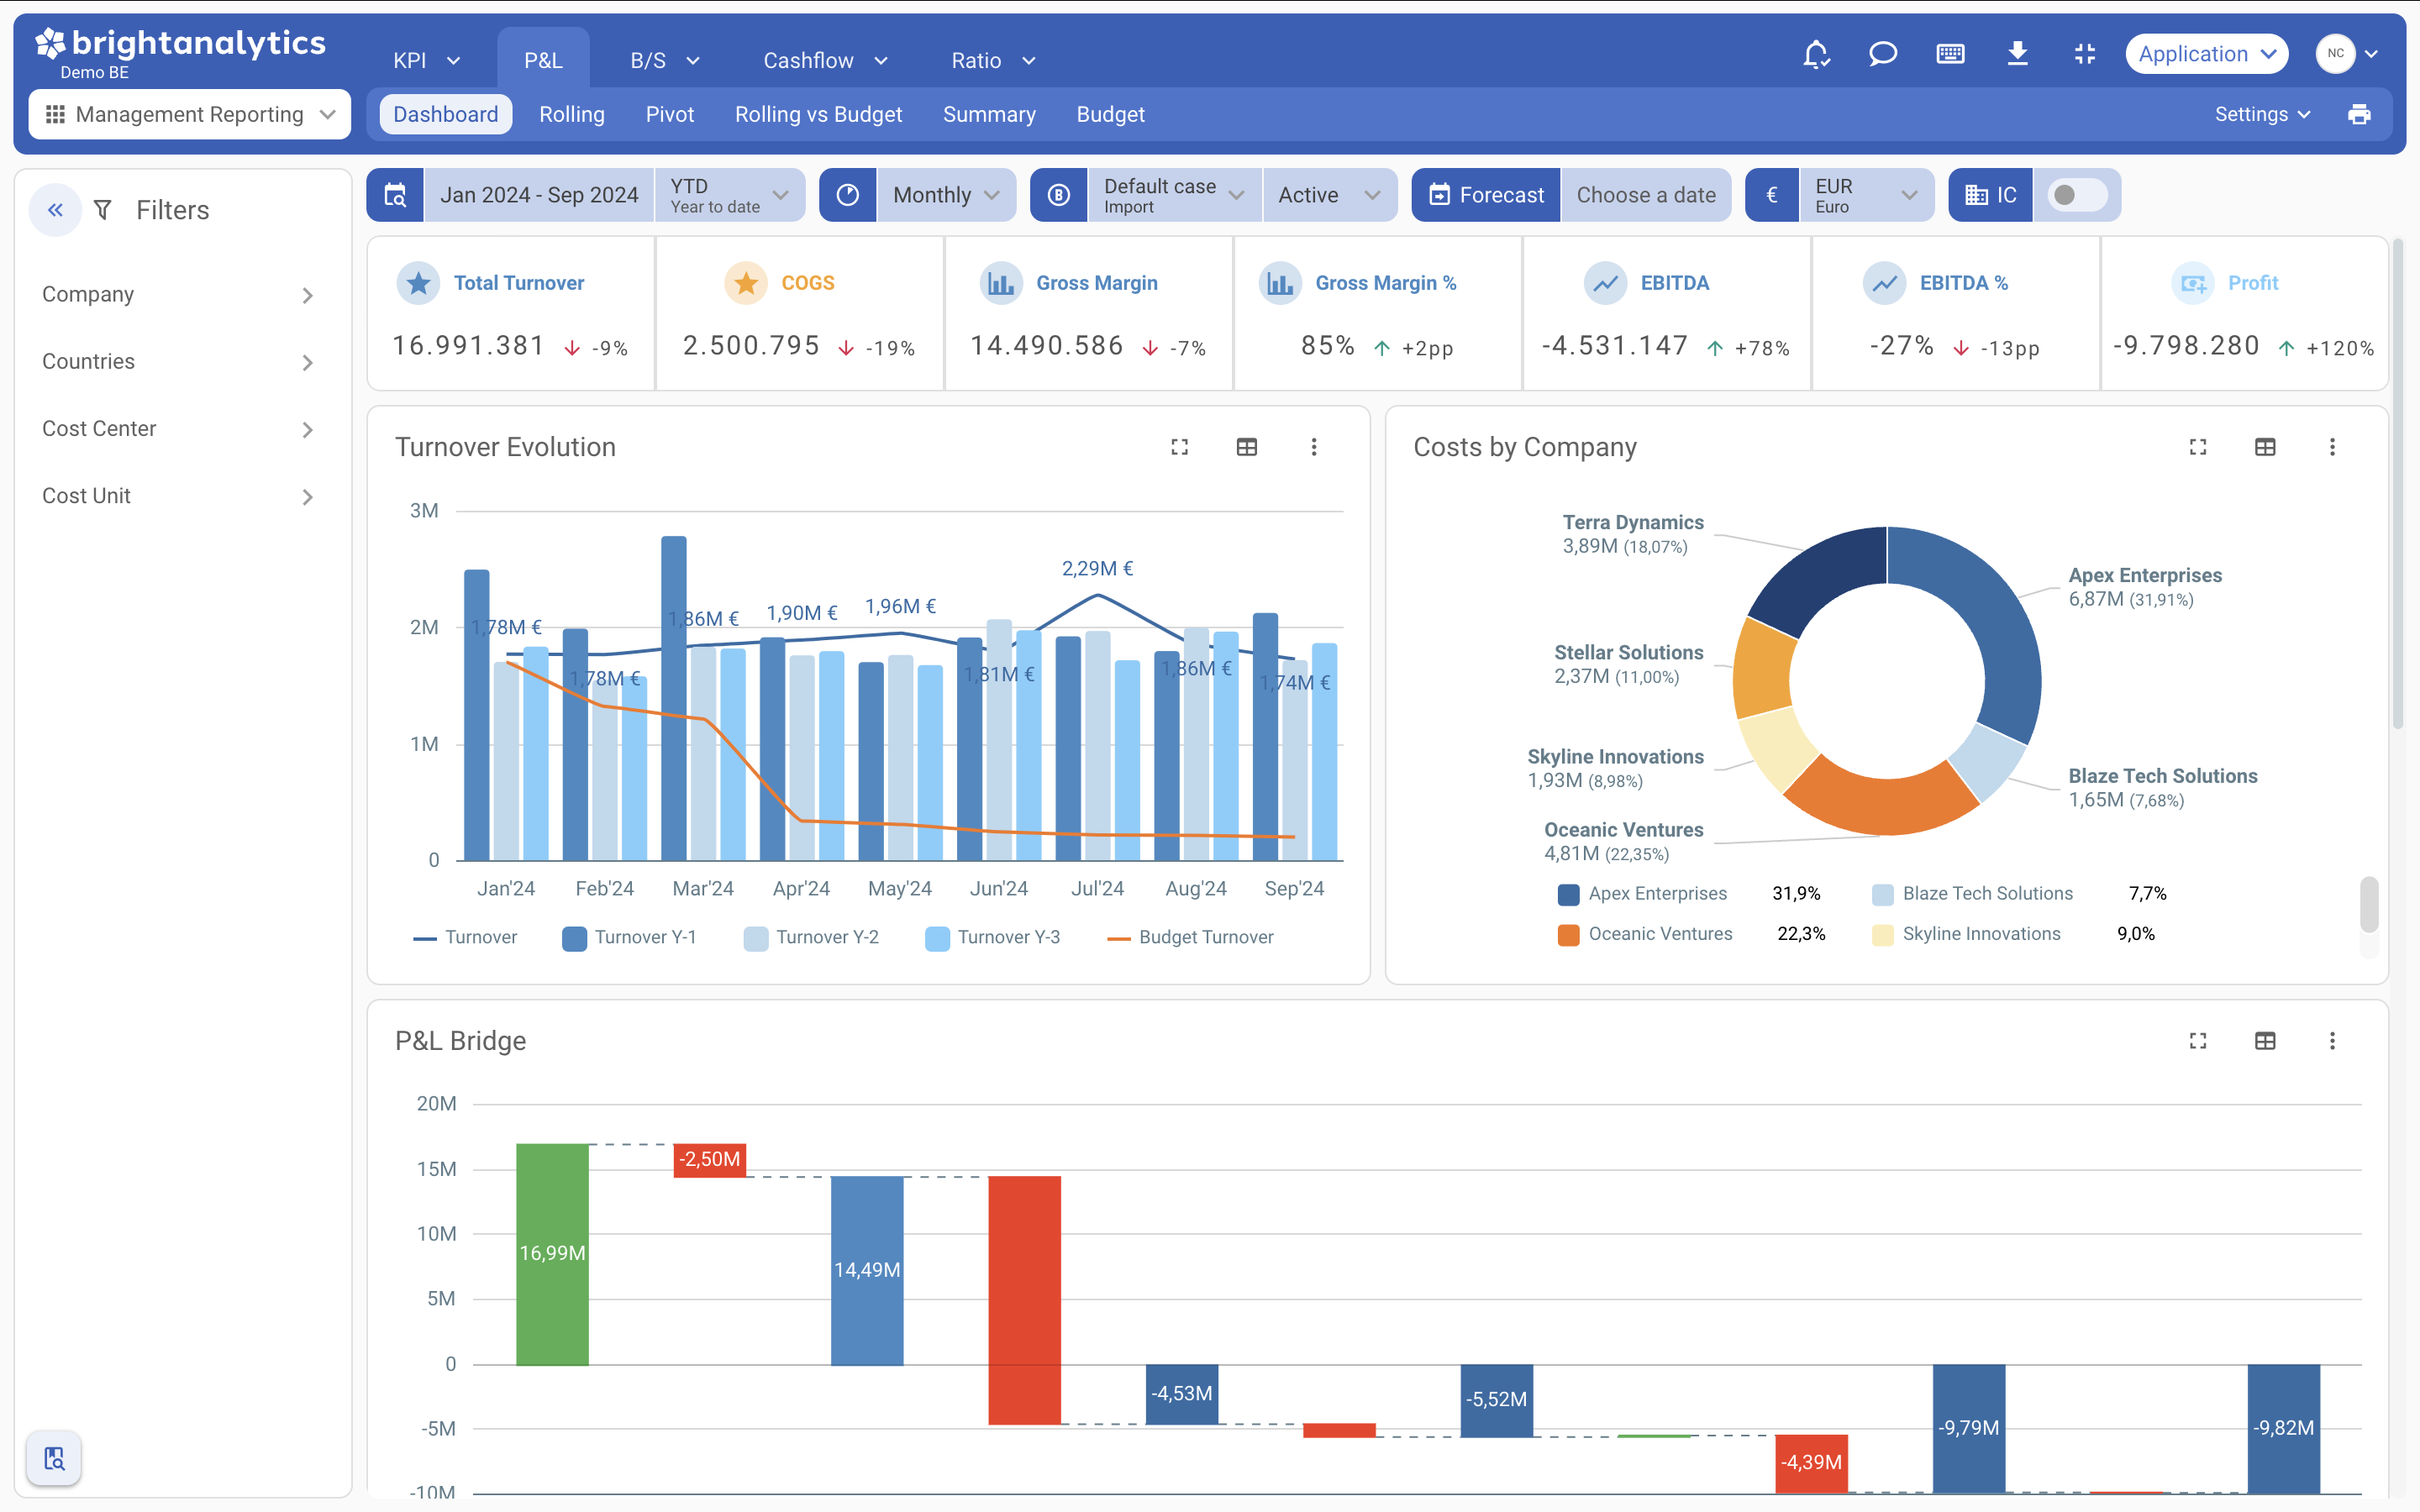
financial kpis template
Source: BrightAnalytics
Frequently Asked Questions
What should a financial planning analysis template contain?
A practical template should normally include assumptions, historical actuals, revenue drivers, expense schedules, projected income statement, cash flow, balance sheet, working capital, capital expenditure, financing, KPIs, scenarios, and a management dashboard. The exact level of detail should reflect the decisions the model is intended to support.
Is Excel suitable for financial planning?
Excel is suitable for many financial planning situations because it supports formulas, tables, charts, scenario analysis, and financial statements in a flexible workbook. Microsoft provides financial management templates for areas including cash flow, income statements, expense budgets, and personal financial planning. :contentReference[oaicite:3]{index=3}
How far ahead should a financial plan forecast?
The appropriate horizon depends on the decision. A monthly forecast may be appropriate for near-term cash management, while a multi-year forecast can support strategic investment and financing decisions. A five-year horizon is commonly useful when the purpose is to evaluate longer-term growth and funding requirements.
What is the difference between a budget and a financial forecast?
A budget usually represents an approved financial plan for a defined period, while a forecast is an updated expectation of what is likely to happen. A strong planning process can use both: the budget provides the benchmark, while the forecast reflects current information and changing conditions.
Should actual and forecast figures be separated?
Yes. Keeping actual results distinct from forecast assumptions makes variance analysis easier and reduces the risk of accidentally changing historical information. The transition between actual and forecast periods should be clearly identified in the workbook.
How can I make a financial model easier to audit?
Use consistent formulas, separate inputs from calculations, document assumptions, avoid unnecessary hardcoding, add reconciliation checks, and organize the workbook into logical schedules. A reviewer should be able to trace an important output back to its operational driver.
What KPIs should be included?
Choose KPIs that relate directly to the organization’s objectives. Depending on the business, useful measures may include revenue growth, gross margin, operating margin, EBITDA margin, cash conversion, working capital, debt ratios, return measures, and budget-to-actual variance. Fewer well-defined metrics are usually better than an overloaded dashboard.
How often should the template be updated?
Near-term cash forecasts may need frequent updates, while strategic planning models can be reviewed monthly or quarterly depending on business complexity. At minimum, significant changes in actual performance, strategy, financing, pricing, staffing, or investment plans should trigger a review.
Can a financial planning analysis template be used for scenario planning?
Yes. Scenario planning is one of the most useful applications. Create a controlled base case and alternative cases that change important drivers such as revenue growth, pricing, costs, headcount, capital expenditure, collection timing, or financing. Compare both profitability and cash outcomes.
What is the most important feature of a financial planning analysis template?
The most important feature is a reliable connection between assumptions, calculations, and decisions. A template does not become valuable simply because it contains many formulas or charts. It becomes valuable when users can understand what is driving the forecast, identify risks, compare alternatives, and take informed financial action.
Conclusion
A financial planning analysis template should function as a connected financial decision system rather than a static spreadsheet. The strongest models combine operational drivers, historical data, forecasts, financial statements, cash planning, scenarios, KPIs, and clear management reporting.
For Excel users, the practical starting point is to build a transparent structure with controlled assumptions and clearly separated historical and forecast periods. From there, connect revenue, costs, working capital, capital expenditure, financing, cash, and the balance sheet so that changes in one part of the model flow logically through the rest.
A five-year view can add strategic perspective, while monthly detail can provide the operational visibility needed for budgeting and cash management. Scenario analysis adds another layer of usefulness by showing how changes in important assumptions can affect profitability, liquidity, and funding needs.
The final goal is not a complicated workbook. The goal is a model that people trust, understand, update, and use. When the financial planning analysis template consistently turns assumptions into measurable outcomes and measurable outcomes into decisions, it becomes a practical foundation for better financial planning and analysis.
Used thoughtfully, the template can support budgeting, forecasting, variance analysis, investment decisions, financing discussions, performance management, and long-term strategy while giving decision-makers a clearer view of how today’s choices can shape tomorrow’s financial position.

Source: Wikimedia Commons
A well-designed financial planning analysis template ultimately succeeds when it makes financial information easier to understand, easier to challenge, and easier to act upon. By keeping assumptions explicit, calculations connected, outputs focused, and reviews consistent, organizations can turn Excel from a collection of numbers into a disciplined framework for planning, analysis, and better financial decisions.
