For a small business, the chart may contain only a finance manager, accountant, bookkeeper, and administrative support. A larger organization may separate the function into controllership, treasury, financial planning and analysis, tax, internal audit, accounts payable, accounts receivable, payroll, financial reporting, and specialized finance operations. The appropriate structure depends on the organization’s size, industry, risk profile, operating model, and reporting requirements.
This guide explains how to design, customize, and maintain a finance organizational chart Template for practical business use. It covers department roles, reporting relationships, chart formats, spreadsheet and document workflows, common mistakes, implementation steps, examples, and questions that frequently arise when organizations build or update their finance structure.
What Is a Finance Organizational Chart?
A finance organizational chart is a visual representation of the people, roles, teams, and reporting relationships within a finance function. It normally places the head of finance near the top and then branches into the major areas that support financial operations. The chart can show positions rather than individual employees, which is particularly useful when the document is intended to remain accurate after staff changes.
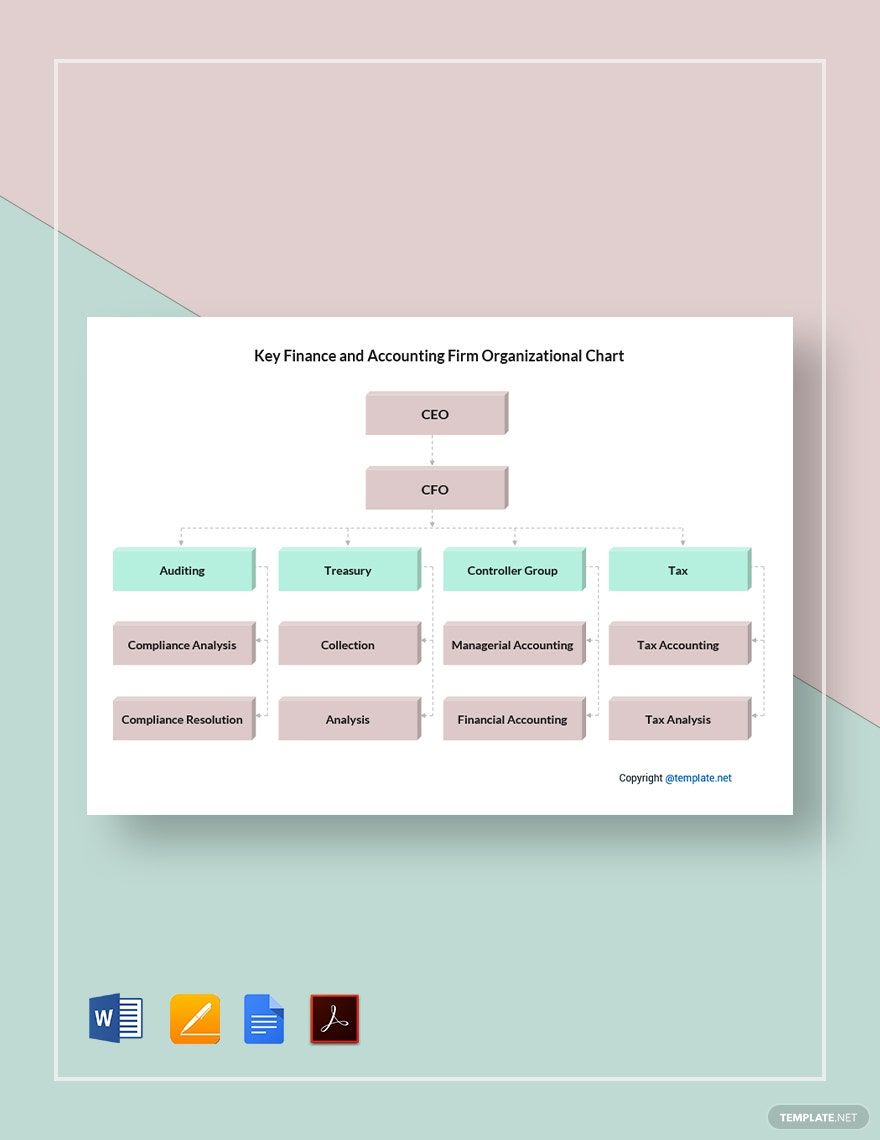
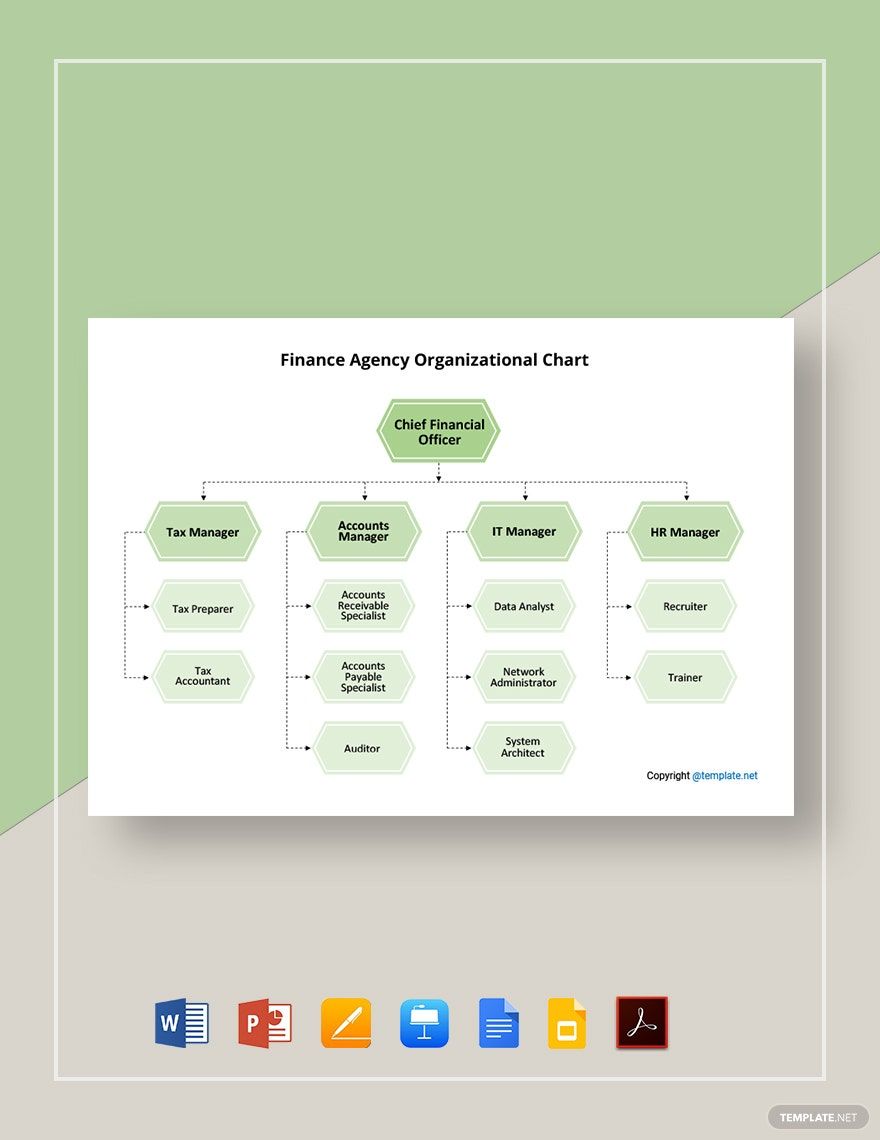
In a typical structure, the chief financial officer or finance director may oversee several major functions. These can include accounting and reporting, treasury, financial planning and analysis, tax, internal controls, payroll, accounts payable, accounts receivable, and finance operations. Not every organization needs every function as a separate team. Smaller businesses frequently combine several responsibilities under one manager or accountant.
The purpose of an organizational chart is not to prescribe one universal hierarchy. Organizational structures differ considerably. Microsoft describes an organization chart as a diagram showing relationships among employees, titles, and groups, and its guidance also supports creating charts from structured employee data. :contentReference[oaicite:0]{index=0}
A finance organizational chart Template therefore works best as a framework rather than a rigid organizational rule. The template provides the visual architecture, while the organization supplies the actual positions, reporting lines, departments, and responsibilities. This distinction is important because a copied chart may look professional while failing to represent the company’s real operating model.
For that reason, the strongest finance charts are designed around actual accountability. Every box should answer a useful question: Who owns this function? Who performs the work? Who approves important decisions? Who provides independent oversight? Who receives the resulting reports? When these relationships are clear, the chart becomes a management tool instead of merely an attractive diagram.
Why a Finance Organizational Chart Matters
Finance teams handle information and activities that influence cash, profitability, financial reporting, budgets, taxes, investments, controls, and business decisions. When responsibilities are unclear, routine transactions can become dependent on informal knowledge. A visual structure helps make ownership visible and gives employees a common reference point.
A chart can also support onboarding. A new finance employee may understand their immediate manager quickly but still need to know where treasury, tax, accounts receivable, reporting, and planning responsibilities sit. A concise organizational chart can answer those questions without requiring a long policy document.
Another benefit is role clarity. Finance functions often overlap operationally even when their responsibilities are different. Accounts payable processes vendor invoices, treasury manages liquidity and banking relationships, and controllership focuses on accounting records and reporting. The chart can show how these functions relate without suggesting that one person necessarily performs every task.
Organizational charts are also useful during restructuring. Management can create a current-state chart, a proposed-state chart, and a transition plan. Comparing those versions makes it easier to discuss vacant positions, newly created functions, consolidated teams, and changes in reporting lines.
Finally, a finance chart can support workforce planning. If the organization expects transaction volume, geographic coverage, or regulatory complexity to increase, the chart can show where additional capacity may be needed. It should not be treated as a staffing forecast by itself, but it can provide a useful visual foundation for that discussion.
Core Components of a Finance Organizational Chart
The first component is the leadership layer. Depending on the organization, this might be a CFO, VP of Finance, finance director, head of finance, or controller. The title matters less than the actual scope of authority. The top role should represent the person accountable for the finance structure being documented.
The second component is the functional layer. Common finance functions include accounting, financial reporting, treasury, financial planning and analysis, tax, payroll, accounts payable, accounts receivable, internal control, compliance, and finance operations. Some organizations place internal audit outside the finance reporting line to preserve independence.
The third component is the management layer. A department chart should make it clear which manager owns each group. For example, an accounting manager may supervise general ledger accountants, while an AP manager may supervise invoice-processing specialists. In a small business, these functions may report directly to one finance manager.
The fourth component is the individual contributor layer. This level can include accountants, analysts, specialists, clerks, coordinators, and finance administrators. Whether individual names belong in the chart depends on the document’s purpose. A role-based chart is usually easier to maintain than a name-based chart.
The fifth component is the relationship system. Solid lines generally represent direct reporting, while dotted lines can be used for secondary, advisory, project, or matrix relationships. If multiple line types are used, include a small legend so readers do not have to interpret the design themselves.
Common Finance Department Roles
CFO or Head of Finance
The CFO or head of finance typically provides overall financial leadership. Depending on the organization, the role may cover financial strategy, reporting, capital decisions, risk oversight, budgeting, treasury, and relationships with senior management or the board. In smaller companies, the same leader may also be deeply involved in accounting and daily cash management.
A useful chart should avoid assuming that every CFO has identical responsibilities. Some organizations place tax, treasury, accounting, FP&A, and internal audit under different reporting arrangements. The chart should reflect the actual governance structure rather than an idealized textbook version.
Controller
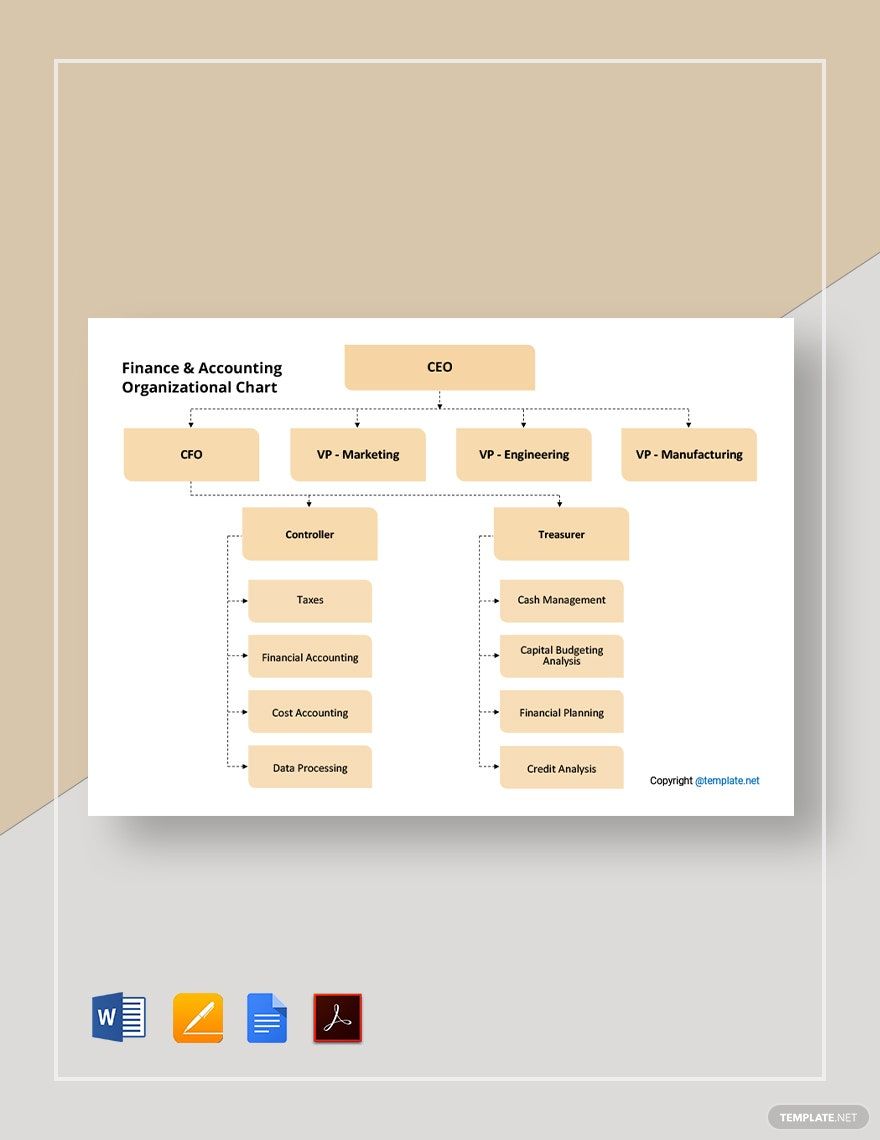
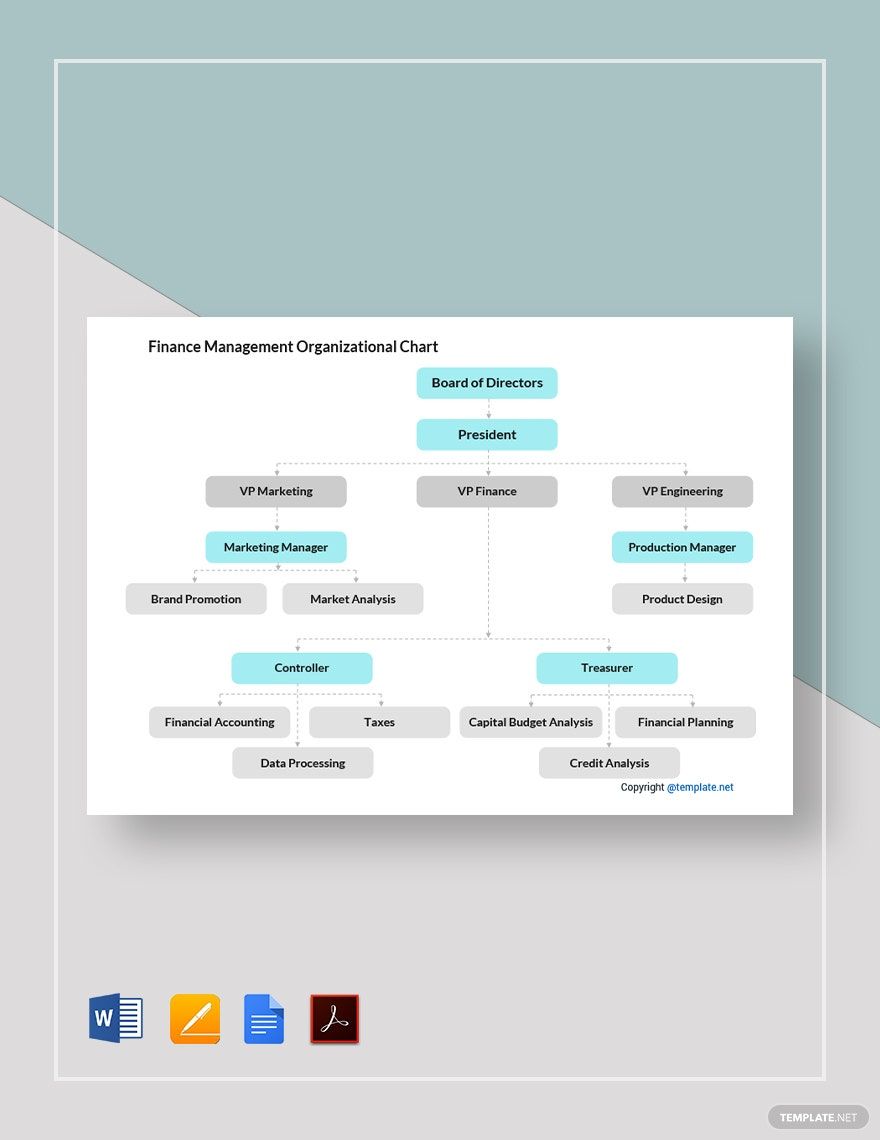
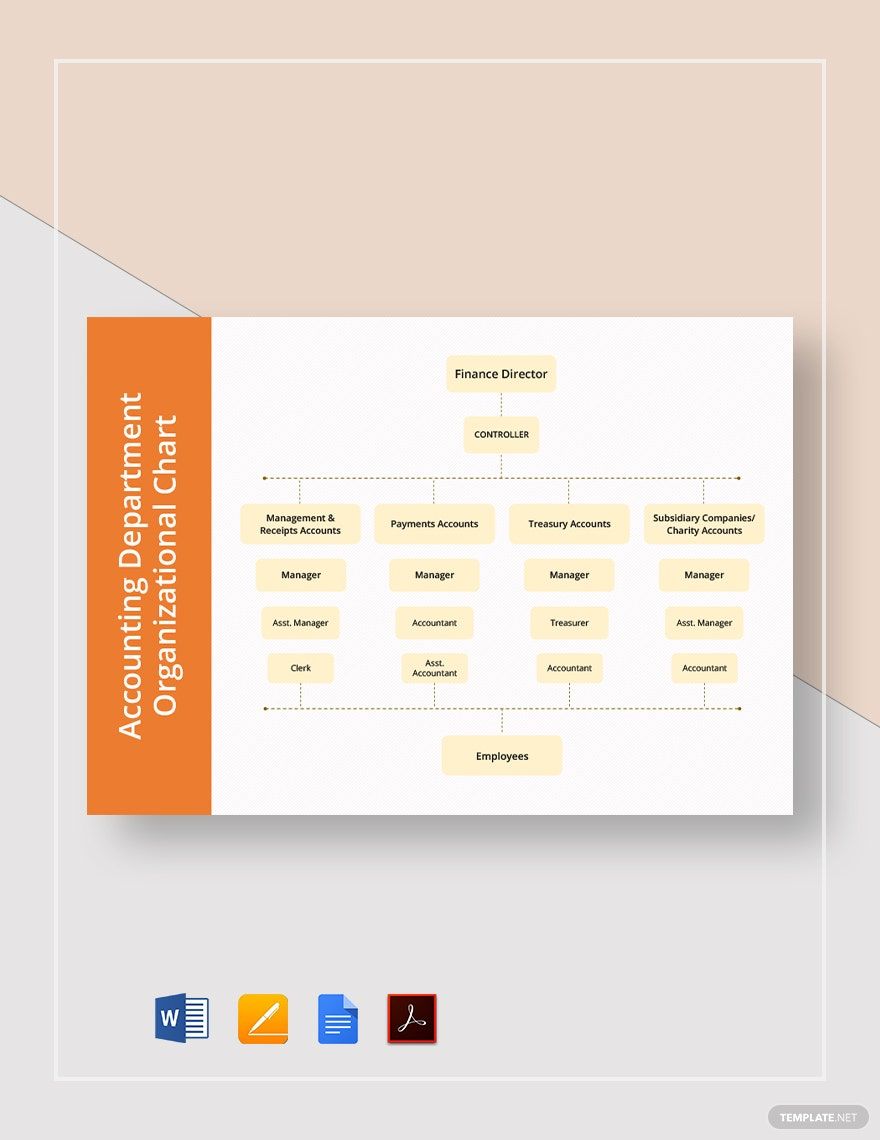
The controller commonly oversees accounting operations and financial reporting. Responsibilities can include general ledger management, month-end close, reconciliations, financial statements, accounting policies, internal controls, and coordination with auditors. OpenStax describes the controller as being heavily involved in financial reporting and oversight of accounting activities, including areas such as accounts payable and accounts receivable. :contentReference[oaicite:1]{index=1}
For a growing company, the controller branch may include an accounting manager, general ledger team, reporting team, AP, AR, payroll accounting, and technical accounting. The exact configuration depends on transaction volume and complexity.
Treasury
Treasury generally focuses on liquidity, banking, cash positioning, financing, investments, and financial risk management. In some organizations, treasury is a distinct department; in others, cash management is handled by the finance manager or controller.
A chart should distinguish treasury responsibilities from accounting responsibilities when the organization has separate teams. Accounting records transactions and prepares financial information, while treasury commonly manages cash and financing activities. The two functions interact closely but should not be presented as interchangeable.
Financial Planning and Analysis
FP&A supports budgeting, forecasting, management reporting, scenario analysis, and financial decision-making. It often works closely with operations, sales, production, and executive leadership rather than operating only inside the accounting cycle.
In an organizational chart, FP&A may report directly to the CFO or sit under a finance planning director. Analysts can then be organized around business units, regions, products, or centralized planning responsibilities.
Specialized Finance Functions to Consider
Tax is frequently represented as a separate function because tax planning, compliance, filing, and tax accounting can require specialized knowledge. A small company may use an external tax adviser while keeping internal tax coordination under accounting.
Accounts payable manages supplier invoices, payment approvals, vendor records, and related transaction controls. It often works with procurement and treasury, making clear ownership especially useful when designing the chart.
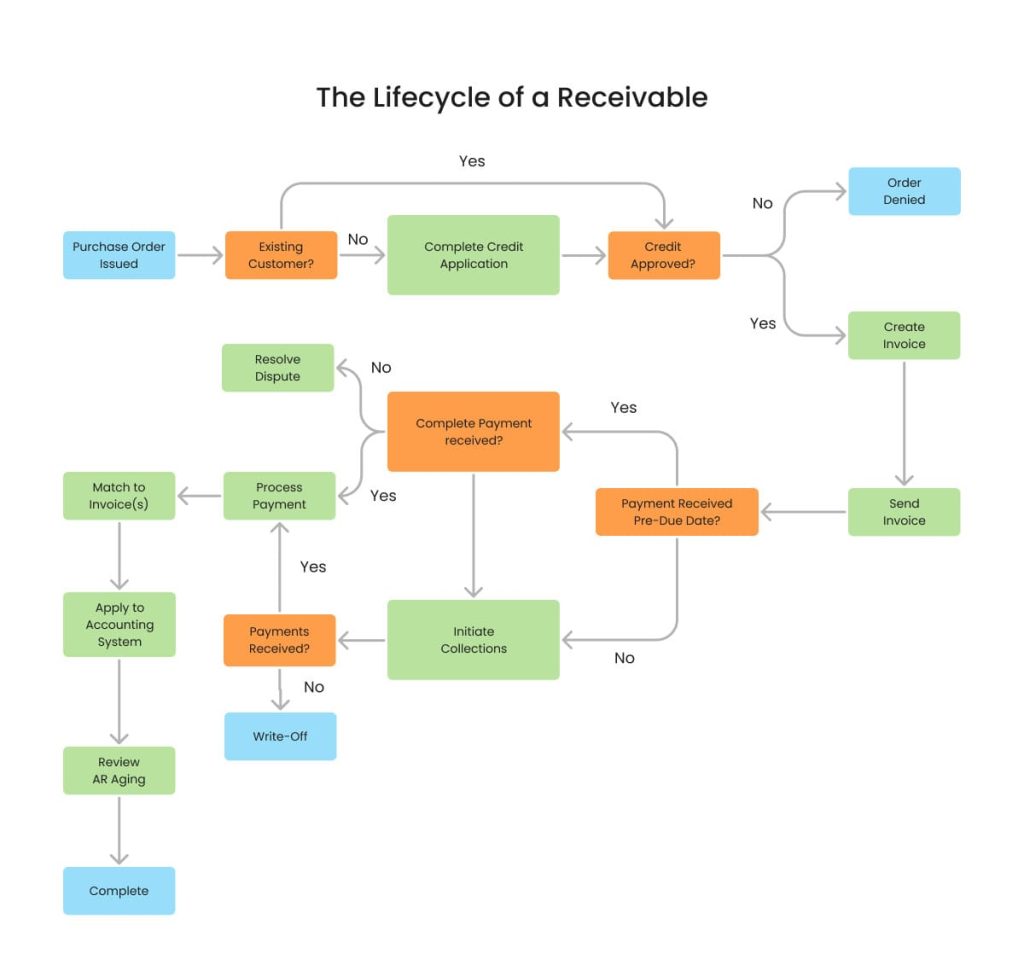
Accounts receivable manages customer billing, cash application, collections, and receivables records. Depending on the business model, AR may be closely connected to sales operations or customer service while remaining accountable to finance.
Payroll can sit inside finance, human resources, or a shared-services organization. If payroll is shown on the finance chart, specify whether the team owns payroll processing, payroll accounting, tax coordination, or only the financial reconciliation component.
Internal audit and compliance deserve special attention. An internal audit function may have an administrative relationship with finance while retaining an independent reporting relationship to the board or audit committee. The chart should make that distinction visible instead of implying that an independent assurance function is simply another operational accounting team.
Choosing the Right Chart Structure
Hierarchical Structure
A hierarchical chart is the most familiar option. The head of finance sits at the top, followed by managers and specialists. It is easy to read and works well for organizations where direct reporting relationships are stable.
For many small and medium-sized businesses, this is the best starting point because it communicates accountability without introducing unnecessary complexity. A hierarchy can also be expanded as new functions are created.
Functional Structure
A functional chart groups work according to specialist areas. Accounting, treasury, tax, FP&A, and financial operations each receive a defined branch. This is useful when the organization has multiple specialized teams and wants to show the distinction between them.
The functional approach is especially helpful when employees need to understand which team handles a particular type of request. It can also support process ownership discussions because each function can be connected to its major responsibilities.
Matrix Structure
A matrix arrangement can be appropriate when finance employees have both functional managers and business-unit or project relationships. In this situation, solid and dotted lines can communicate different types of accountability.
Matrix charts should be used carefully. Too many lines can make the chart difficult to interpret. If the organization has many secondary relationships, it may be better to create a primary finance chart and a separate responsibility matrix.

How to Create a Finance Organizational Chart Template
Start by defining the purpose of the chart. A board-level chart may need only senior roles and major functions. An internal operations chart may need managers, specialists, and support positions. A recruitment chart may focus on positions and vacancies rather than employee names.
Next, collect the underlying data. At minimum, record each position, department, manager, and reporting relationship. If you are using a spreadsheet as the source, give every position a stable identifier where possible. Microsoft notes that organization charts generated from data depend on information such as employee names, unique identifiers, and who each employee reports to. :contentReference[oaicite:2]{index=2}
Then group roles into logical functions. For example, general ledger, financial reporting, and accounting operations may belong under controllership. Cash management and financing may belong under treasury. Budgeting and forecasting may belong under FP&A.
After that, choose the visual hierarchy. Place the top finance role at the highest level and arrange direct reports beneath it. Keep peer functions aligned horizontally when possible. Avoid creating a different shape for every role unless the distinction has a specific meaning.
Finally, review the draft with the people responsible for finance operations. They can identify inaccurate reporting lines, missing positions, duplicated responsibilities, or functions that belong outside the finance department.
Using finance organizational chart template excel
A spreadsheet-based chart can be useful when the underlying employee and reporting data already exists in rows and columns. A practical source table might contain Position ID, Employee Name, Job Title, Department, Manager ID, Function, Location, and Status.
The key advantage of a spreadsheet workflow is maintainability. Instead of manually editing dozens of boxes whenever someone changes roles, you can update the source table and regenerate or rebuild the visual chart.
Excel is also useful for preparing the data before importing it into a diagramming application. Microsoft Visio, for example, can use Excel or delimited text as a source for organization charts. :contentReference[oaicite:3]{index=3}
When building the spreadsheet, avoid relying only on employee names. Names can change, and duplicate names can create ambiguity. A stable employee or position identifier is more reliable for mapping reporting relationships.
For a small organization, the spreadsheet itself may be enough to maintain the structure while a separate visual chart is used for presentation. For a large organization, keeping the data and visualization conceptually separate can make updates much easier.

Using finance organizational chart template word
Word can be appropriate when the chart is part of a policy manual, finance handbook, organizational review, or printed management document. A Word-based chart can sit alongside explanations of responsibilities and approval procedures.
Word is most effective when the hierarchy is relatively stable and the chart does not contain hundreds of positions. For a large department, a dedicated diagramming application or data-driven workflow may be easier to maintain.
When preparing a Word version, keep the chart visually separate from long explanatory text. Use a clear heading, consistent role labels, and enough spacing to prevent boxes from becoming unreadable when printed.
A role-based Word chart is usually more durable than a chart filled with personal information. If the purpose is to explain structure rather than contact information, use titles and functions first and place detailed employee information in a separate directory.
Before distributing the document, check that the chart remains legible in both digital and printed versions. A structure that looks clear at full screen size may become difficult to read when inserted into a standard portrait page.

Using finance organizational chart template google docs
Google Docs can work well when a finance team needs a document that several authorized users can review and update. It is particularly useful for organizations that already maintain policies, procedures, and internal documentation in Google Workspace.
The most important consideration is version control. Assign a clear document owner and define who is allowed to modify the organizational structure. Collaborative editing is valuable, but unrestricted changes to reporting lines can create confusion.
A Google Docs chart should also have a visible effective date. If the structure changes regularly, readers should be able to determine whether they are looking at the current version or an older reference document.
For larger charts, consider linking the main document to a separate data source or a dedicated diagram. The document can then provide the explanatory context while the visual system handles more complex relationships.
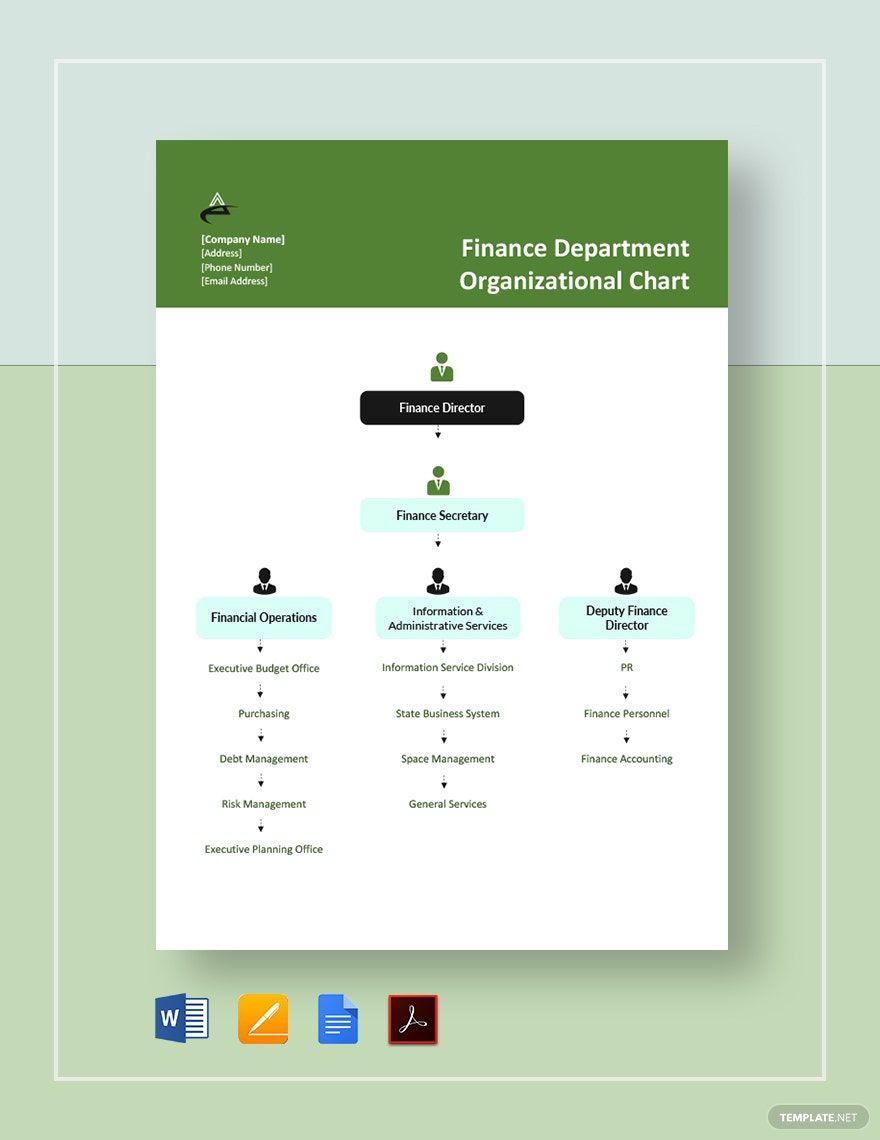
Template.net publishes finance chart examples that are presented for Word, Google Docs, and PDF workflows, illustrating how the same basic hierarchy can be adapted to multiple document formats. :contentReference[oaicite:4]{index=4}

Using finance organizational chart template google sheets
Google Sheets can serve as the central data table behind a finance organizational chart. This is useful when multiple stakeholders need to maintain position information, reporting relationships, departments, or status fields.
Start with one row per position or employee. Use columns for the position ID, name, title, manager ID, function, location, and employment status. If the chart is role-based, leave personal names out and focus on position IDs and titles.
Use data validation where practical. Standardized department names and role categories reduce spelling differences that can otherwise create duplicate categories or incorrect groupings.
Protect formula columns and reference fields that should not be manually changed. A controlled structure reduces the chance that one accidental edit breaks the reporting hierarchy.
For collaborative teams, document the update process alongside the sheet. Define who updates new hires, transfers, vacancies, reorganizations, and departures, and establish a review schedule so the visual chart remains synchronized with the source data.

Using finance organizational chart template pdf
PDF is generally best treated as a distribution format rather than the primary editing format. A PDF can preserve the appearance of the chart and make it easier to circulate a finalized version without allowing casual changes.
A PDF version is useful for board packs, internal policy documents, onboarding materials, presentations, and printed organizational reviews. The document should contain an effective date and, where appropriate, a version number.
When exporting to PDF, inspect the final page at normal reading size. Small boxes and thin connector lines can become difficult to read after conversion, especially when a large chart has been reduced to fit on one page.
If the organization has more positions than can reasonably fit on one page, split the information logically. One page can show executive finance leadership and major functions, while additional pages can show detailed accounting, treasury, or finance operations structures.
A PDF should never be treated as the source of truth when the organization changes frequently. Maintain the editable source separately and export a new PDF whenever the structure is formally updated.

Using finance organizational chart template powerpoint
PowerPoint is useful when the finance organizational chart will be presented to executives, managers, investors, or other stakeholders. Its slide-based format provides more room for landscape-oriented structures than a typical document page.
A presentation version should prioritize readability over detail. If the audience needs to understand the overall structure, show major functions rather than every individual contributor.
Detailed slides can then explain each branch. For example, one slide can show the CFO structure, another can show controllership, and another can show treasury and FP&A. This approach prevents the main slide from becoming an unreadable collection of tiny boxes.
PowerPoint also makes it easy to create a current-state and future-state comparison. The two charts can be shown on separate slides with a short explanation of what changes and why.
Some commercial finance organization chart resources are explicitly offered in PowerPoint alongside PDF and other editable formats, which demonstrates why presentation and document versions can be useful for different audiences. :contentReference[oaicite:5]{index=5}

How to Design an Organizational Chart for Finance Department
When designing an organizational chart for finance department use, begin with accountability rather than appearance. Ask who owns each major financial function, then map the managers and positions below those owners.
Keep peer functions visually consistent. If controller, treasurer, FP&A director, and tax director are all direct reports to the CFO, place them at the same hierarchy level unless the actual reporting structure says otherwise.
Use labels that employees understand. A chart full of internal abbreviations may be efficient for a specialist team but confusing for executives, new employees, auditors, or other departments.
Separate reporting relationships from workflow relationships. A procurement manager may collaborate heavily with accounts payable without reporting to the AP manager. Showing every operational interaction as a reporting line can make the chart misleading.
Finally, include only information that serves the chart’s purpose. A finance organization chart should communicate structure quickly. Detailed job descriptions, process instructions, approval thresholds, and KPIs can be documented elsewhere.

Finance Organization Chart Template Example
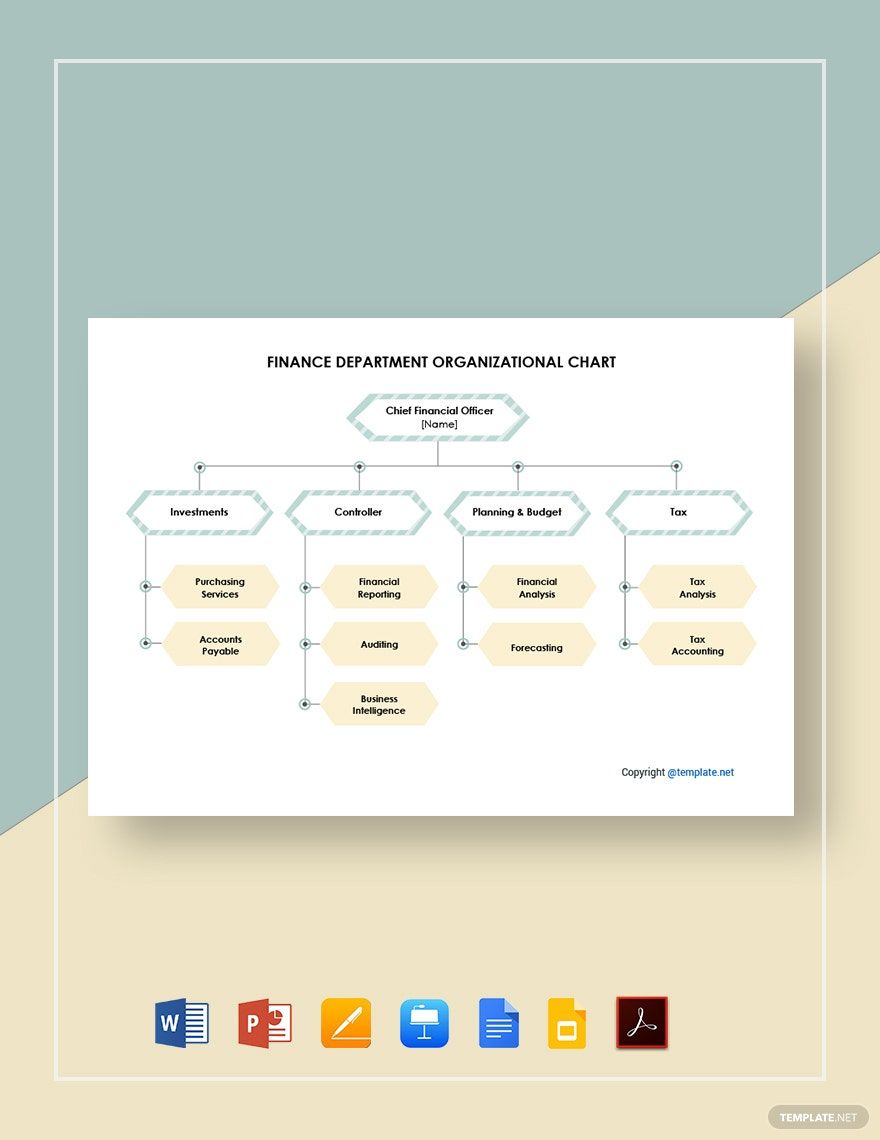
Consider a hypothetical mid-sized company with a CFO who oversees four primary areas: controllership, treasury, FP&A, and tax. The controller manages general ledger accounting, financial reporting, AP, AR, and payroll accounting.
The treasury manager manages cash positioning, banking relationships, debt administration, and short-term liquidity planning. The FP&A manager oversees budgeting, forecasting, management reporting, and business-unit analysis.
The tax manager coordinates tax compliance, tax accounting, and external advisers. Internal audit is shown with an independent reporting line to the audit committee while maintaining an administrative relationship with the CFO.
This structure gives management a useful picture without assuming that every company needs exactly the same roles. If the company is smaller, AP, AR, payroll, and general accounting could be handled by a single accounting manager.
If the company grows, each function can be expanded. For example, AP can become its own team, FP&A can be divided by business unit, and treasury can add specialists for cash management and financing.

Practical Workflow for Building the Chart
Step one is to collect the current structure from authoritative internal sources. Useful sources may include HR records, finance policies, department rosters, reporting matrices, job descriptions, and management-approved restructuring documents.
Step two is to reconcile the information. If an HR roster says one person reports to the CFO while the finance policy says that person reports to the controller, do not simply choose one version. Investigate the difference and determine which relationship is current.
Step three is to create a clean source table. Each row should represent a position or employee, and the manager reference should use a consistent identifier. This makes errors easier to detect than a manually drawn hierarchy.
Step four is to create the visual chart. Start with the highest-level role, add direct reports, and continue downward. Keep the number of hierarchy levels manageable on each page.
Step five is to validate the finished chart. Ask each functional leader to confirm their branch. Then ask an independent reviewer to check whether the chart is understandable to someone who does not already know the department.
Common Mistakes to Avoid
One common mistake is copying a generic chart without adapting it. A template is a starting point, not evidence that a particular structure is correct for every business.
Another mistake is confusing titles with responsibilities. Two companies may use the title “finance manager” for very different scopes. The chart should reflect the actual reporting and functional responsibilities behind the title.
A third mistake is putting too much information on one page. If the reader needs to zoom dramatically to read every box, the chart is probably trying to serve too many purposes at once.
A fourth mistake is failing to distinguish direct and indirect relationships. Matrix reporting, advisory relationships, and independent assurance functions should be visually differentiated where they matter.
A fifth mistake is allowing the chart to become outdated. An old chart can be worse than no chart because employees may rely on incorrect reporting information. Assign ownership and establish a review cadence.

Best Practices for a Professional Finance Organizational Chart
Use a consistent visual language. Similar roles should have similar box sizes, typography, spacing, and connector styles. Consistency makes the hierarchy easier to scan.
Use functional grouping carefully. Color can distinguish departments, but color should not be the only way information is communicated. Text labels and line relationships should remain understandable in grayscale.
Prefer role-based charts when the structure is the main objective. Names can be useful for an internal contact chart, but role titles make organizational documents more durable.
Include an effective date. If the chart is used as an official internal reference, readers should know when it was last reviewed.
Maintain one authoritative version. Different departments can receive exported versions, but there should be a clearly owned source document or dataset from which those versions are produced.
Practical Solution: Build a Maintainable Finance Organizational Chart
The most practical solution is to separate the finance organizational chart into three layers: source data, structural logic, and presentation. This approach reduces the amount of manual editing required whenever the finance department changes.
Begin with a source table containing Position ID, Position Title, Employee Name where appropriate, Department, Function, Manager ID, Location, and Status. Use Position ID or another stable identifier to connect each role to its manager.
Next, define the structure. Decide which roles report directly to the CFO or finance director, which positions sit under the controller, which functions belong to treasury, and where FP&A, tax, payroll, and other specialist functions belong.
Then create the presentation layer. Choose the appropriate format based on the audience. Excel or Google Sheets can work well as the underlying data source; Word or Google Docs can support policy documentation; PowerPoint can support presentations; and PDF can distribute an approved snapshot.
After the first version is complete, validate it with finance leadership and HR. Check direct reporting relationships, vacant positions, shared responsibilities, independent oversight relationships, and any functions that have recently moved.
Finally, establish ownership. A practical governance rule is to assign one person or team responsibility for maintaining the chart, while requiring relevant managers to confirm changes. This turns the chart from a one-time design exercise into a maintained organizational record.
Reference Examples
The following examples provide visual references for different finance and organizational chart formats. Each example corresponds to one of the requested search phrases and should be treated as a visual reference rather than a statement that every organization should use the same structure.
finance organizational chart template excel

Source: Wikimedia Commons
finance organizational chart template free
Source: Template.net
finance organizational chart template word
Source: Template.net
finance organizational chart template google docs
Source: Template.net
finance organizational chart template google sheets

Source: Wikimedia Commons
finance organizational chart template pdf
Source: Wikimedia Commons
finance organizational chart template free download
Source: Wikimedia Commons
finance organizational chart template powerpoint
Source: Wikimedia Commons
finance organization chart template

Source: LinkedIn
organizational chart for finance department
Source: Quizlet
free organizational chart template
Source: Wikimedia Commons
free company organizational chart template
Source: Wikimedia Commons
Frequently Asked Questions
What should a finance organizational chart Template include?
It should normally include the head of finance, major finance functions, management roles, and reporting relationships. Depending on the purpose, it can also include individual positions, vacancies, locations, or secondary reporting relationships.
How detailed should a finance organizational chart be?
The appropriate level of detail depends on the audience. A leadership chart can show only major functions, while an operational chart can show managers, specialists, and support roles. Avoid putting so much detail on one page that the hierarchy becomes difficult to read.
Should employee names appear on a finance organization chart?
Names can be included when the chart is intended as an internal contact or team directory. For long-term structural documentation, role-based labels are often easier to maintain because they remain useful when employees change.
Can a finance chart include dotted reporting lines?
Yes. Dotted lines can represent secondary reporting, advisory relationships, project relationships, or matrix arrangements. The chart should include a legend whenever different line styles have different meanings.
Is Excel a good format for a finance organizational chart?
Excel can be useful as the structured data source for an organizational chart, especially when the finance team changes frequently. It is particularly effective when each position has a stable identifier and a manager reference.
Is a PDF better than an editable chart?
PDF is usually better for distributing an approved snapshot, while an editable source is better for maintenance. A strong workflow keeps the editable version as the source and exports PDF versions when needed.
What is the difference between a finance chart and an accounting chart?
An accounting chart typically focuses on accounting activities such as the general ledger, reporting, AP, AR, and payroll accounting. A broader finance chart may also include treasury, FP&A, tax, corporate finance, risk, and other financial management functions.
How often should a finance organizational chart be updated?
It should be reviewed whenever there is a material organizational change and periodically even when no changes are expected. The review interval should reflect how frequently the finance function changes.
Conclusion
A well-built finance organizational chart Template gives an organization a clear visual explanation of finance leadership, responsibilities, reporting relationships, and functional ownership. The best chart is not necessarily the most elaborate one; it is the one that accurately reflects how work and accountability operate. Start with reliable organizational data, distinguish direct reporting from collaborative relationships, choose a format appropriate to the audience, and maintain an authoritative editable source. Whether the final deliverable is a spreadsheet, document, presentation, or PDF, a carefully maintained chart can make the finance function easier to understand, manage, review, and improve.
