Traditional workforce planning already provides a useful foundation. Smartsheet describes workforce planning as an ongoing process for aligning people, skills, and organizational requirements, while its workforce forecasting template considers business goals, current workforce characteristics, future requirements, gap analysis, workforce development, and review. Those concepts can be extended to digital employees by adding automation capacity, AI-agent roles, technology costs, process coverage, human oversight, and scenario assumptions.
This guide explains how to design a practical digital employees forecast template, how to choose between Excel, Google Sheets, Word, PDF, and presentation formats, how to build assumptions, how to model human and digital capacity together, and how to avoid common forecasting mistakes. The examples use hypothetical numbers where necessary so they can be adapted without being mistaken for industry statistics.
The goal is not to predict the future with false precision. A good forecast is a decision framework. It should make assumptions visible, connect workforce demand to business drivers, show where capacity gaps may appear, and give leaders a consistent way to compare hiring, training, outsourcing, automation, and AI-agent deployment.
What Is a Digital Employees Forecast Template?
A digital employees forecast template is a reusable planning framework that estimates future workforce capacity when an organization uses both human employees and digital labor. The term “digital employee” can refer to different implementations depending on the organization, including AI agents, software bots, automated workflows, virtual assistants, robotic process automation, or other systems that perform defined business tasks.
The important distinction is between a technology asset and a unit of productive capacity. A software license by itself does not necessarily represent an employee equivalent. A forecasting model should instead measure the work the technology can reliably perform. For example, an automated workflow might process invoices, an AI assistant might summarize customer conversations, or a scheduling agent might prepare proposed staffing rosters.
A practical template therefore needs two related views. The first is a capacity view: how much work is expected, how much capacity humans provide, and how much capacity digital systems provide. The second is a cost and governance view: what those resources cost, what assumptions support the forecast, who owns them, and what level of human supervision is required.
Traditional workforce forecasting already uses concepts such as current workforce supply, future workforce demand, skills, employment types, gaps, and development actions. A digital employee model can preserve those elements while adding automation coverage, AI-agent availability, implementation dates, expected utilization, exception rates, maintenance requirements, and human review capacity.
The best template is consequently not the one with the most columns. It is the one that creates a clear chain from business demand to workload, workload to capacity, capacity to resource mix, and resource mix to financial and operational decisions.
Why Businesses Need a Digital Workforce Forecast
Workforce planning becomes difficult when demand changes faster than hiring cycles. Digital labor can sometimes be deployed or scaled differently from human labor, but that does not eliminate planning requirements. It changes them. A digital employee may need software infrastructure, data access, workflow integration, security controls, testing, monitoring, and human supervision before it becomes dependable operational capacity.
A forecast helps leadership separate expected demand from available capacity. If a business expects customer contacts to increase, it can model the required service capacity before deciding whether to hire additional representatives, redesign processes, introduce an AI assistant, outsource part of the workload, or use a combination of approaches.
The same principle applies to internal functions. Finance teams can forecast transaction volumes and determine which activities should remain human-led. HR teams can model recruiting demand while using automation for scheduling, document preparation, or employee questions. Operations teams can forecast project workload and compare employee availability with automated processing capacity.
Another benefit is financial visibility. A human hire usually creates recurring salary and employment-related costs, while a digital worker may create software, infrastructure, implementation, integration, usage, and oversight costs. Those cost structures behave differently, so treating digital employees as identical to human employees can distort a business forecast.
Finally, forecasting creates a common language between finance, HR, operations, technology, and business leadership. Instead of discussing AI adoption as a vague technology initiative, teams can discuss measurable workload, capacity, timing, cost, risk, and expected business outcomes.
Core Components of a Digital Employees Forecast Template
1. Business drivers
Start with the factors that create work. Common drivers include customers, transactions, orders, cases, projects, revenue-producing activities, production units, service requests, regulatory requirements, or geographic expansion. A forecast becomes much more useful when workforce demand is linked to measurable operational drivers rather than arbitrary staffing targets.
For example, a hypothetical customer-service organization might forecast 120,000 monthly contacts. If historical operating assumptions indicate that each human representative can reliably handle a defined workload after accounting for meetings, training, leave, and nonproductive time, the organization can estimate human capacity requirements.
The same workload can then be divided into categories. Routine questions might be suitable for automation, while escalations, complaints, sensitive cases, and complex troubleshooting may require human expertise. This creates a more realistic digital workforce model than simply assuming that a certain percentage of employees will be “replaced” by AI.
Business drivers should be documented with source, owner, period, and confidence level. If a forecast assumes that demand will grow because of a planned product launch, that assumption should be visible rather than hidden inside a formula.
A strong template therefore begins with business demand and only later translates that demand into human and digital capacity. This prevents technology enthusiasm from becoming the starting point for the workforce model.
2. Current workforce baseline
The current workforce baseline should identify the people, roles, skills, employment types, locations, and capacity that exist before the forecast begins. If the organization already maintains an HRIS, payroll database, or workforce planning workbook, those systems should be the primary sources for the baseline rather than manually re-entering information.
For each role, capture the current headcount and, where appropriate, full-time equivalent capacity. FTE is often more useful than raw headcount when comparing full-time, part-time, contractor, and shared-resource arrangements.
The baseline should also distinguish productive capacity from nominal capacity. A team of ten people does not necessarily provide the same usable capacity as ten full-time equivalents working continuously on forecasted tasks. Meetings, training, leave, administration, management, and other obligations reduce the capacity available for a specific workload.
Skills should be included where they materially affect the forecast. A business may have enough people numerically but still lack the technical, analytical, domain, language, or leadership capabilities required to meet future demand.
Digital capacity needs its own baseline. List existing AI agents, bots, automated workflows, or software systems that perform meaningful work, together with the tasks they cover, operating hours, expected reliability, ownership, and human review requirements.

3. Future demand
Future demand is the amount of work the organization expects to handle during the planning period. It can be expressed in units such as cases, hours, transactions, orders, projects, documents, calls, tickets, or other measurable workload categories.
Demand should normally be forecast at the same time granularity used for decision-making. Monthly planning may be sufficient for annual budgeting, while a contact center or production operation may need weekly or daily estimates.
It is useful to separate committed demand from uncertain demand. A signed contract, approved product launch, or confirmed project can be treated differently from an early sales opportunity or speculative market expansion.
Scenario planning can then show how resource requirements change under different assumptions. A base case might use expected demand, a high case might reflect stronger growth, and a low case might reflect delayed projects or weaker demand.
Digital employees are especially suitable for scenario modeling because technology deployment often involves timing assumptions. An automation project might be expected to contribute little capacity during implementation, more capacity during a pilot, and full planned capacity after stabilization.

4. Human capacity
Human capacity should be calculated from available working time rather than simply multiplying headcount by a theoretical number of hours. The model can subtract holidays, planned leave, training, management duties, meetings, administrative work, and other known commitments.
For example, suppose a hypothetical employee has 160 nominal working hours in a month. If 12 hours are allocated to training, 8 to internal meetings, and 16 to leave or other planned absence, the capacity available for the forecasted operational workload is lower than 160 hours.
The template should also distinguish between capacity and capability. Someone may have enough available hours but lack the skills needed for a particular workload. This is why a skills-gap view should sit alongside the capacity calculation.
Role-based capacity is usually easier to manage than employee-by-employee forecasts for long-range planning. Individual records can support the underlying data, while the main forecast summarizes by department, job family, location, skill group, or other meaningful planning dimension.
Human capacity should remain visible even in an automation-heavy forecast. Digital employees often depend on people for supervision, exception handling, quality assurance, process design, escalation, and continuous improvement.
5. Digital capacity
Digital capacity is best modeled according to tasks performed rather than the number of AI tools purchased. One digital employee might complete a large number of routine transactions, while another may support a small group of specialists with research and analysis.
Useful fields include digital worker name, business process, task category, launch date, expected operating hours, workload capacity, expected utilization, quality threshold, exception rate, human review requirement, owner, technology dependency, and cost.
A forecast should avoid assuming 100 percent utilization. Digital systems can experience downtime, queue delays, model limitations, integration failures, data-quality problems, or work that requires human intervention.
Digital capacity should also be measured against quality requirements. Processing more cases is not necessarily better if the automation generates excessive errors or creates additional work for employees.
For planning purposes, it can be useful to define an “effective digital capacity” figure that discounts theoretical output for expected exceptions, review requirements, and availability. This produces a more conservative and decision-useful model.

How to Build the Forecast Step by Step
Step 1: Define the planning horizon
Choose a planning period that matches the business decision. A twelve-month model is practical for annual workforce budgeting, while a three-year view can help with strategic workforce transformation.
Do not make every period equally detailed. A useful approach is to model the next few months at higher resolution and later periods with broader assumptions. This prevents false precision while preserving enough detail for near-term staffing decisions.
Set a clear forecast start date and establish the baseline period. Record when the data was extracted and identify the source systems used for headcount, workload, compensation, and technology capacity.
Separate actual periods from forecast periods. Actual data should generally be locked or clearly identified, while assumptions for future periods should remain editable.
Finally, define the review cadence. A forecast should be refreshed when material business changes occur, not merely when a calendar reminder appears. Smartsheet notes that workforce planning is an ongoing process and may need updates as business circumstances change.

Step 2: Build the assumptions sheet
Keep major assumptions in a dedicated section rather than burying them inside formulas. Typical assumptions include demand growth, productivity, attrition, hiring timing, salary increases, benefit rates, implementation dates, automation coverage, and technology costs.
Each assumption should have a description, value, unit, period, source, owner, and optional confidence rating. This makes the forecast auditable and easier to update.
Digital employee assumptions should be particularly explicit. A statement such as “one AI agent equals five employees” is too broad to be useful unless it specifies the process, workload, quality threshold, time period, and conditions under which the comparison applies.
A better assumption might say that an automated workflow is expected to process a defined class of routine requests during business hours, with humans handling exceptions. That assumption can then be tested against actual performance after deployment.
Version control is also important. When an assumption changes, record the change date and reason. This allows finance and management to understand why a forecast moved between versions.
Step 3: Convert workload into required capacity
The central calculation in a forecast is the conversion of demand into resource requirements. A simplified model can use workload divided by productive capacity per resource, but the exact formula depends on the work type.
For a hypothetical document-processing team, if 40,000 documents are expected and one productive employee can complete 4,000 documents per month under the defined quality standard, the initial human requirement would be ten FTE before considering digital capacity.
If an automated process can reliably handle 12,000 of those documents, the remaining human workload becomes 28,000 documents. The template can then calculate the remaining human requirement using the same productivity assumption.
This is a simplified illustration rather than a universal productivity benchmark. Real organizations should use their own historical data, pilot results, service levels, and quality measurements.
The important design principle is that digital capacity should reduce workload only where the technology actually performs the relevant task. An automation that handles data entry does not automatically provide capacity for customer negotiation, complex analysis, leadership, or exception management.
Step 4: Model hiring, attrition, and deployment timing
Headcount forecasts should account for timing. A role approved in January may not start until March, and a new digital employee may require several weeks of implementation before producing useful operational capacity.
Hiring assumptions should therefore include approval date, recruiting lead time, expected start date, ramp period, and productive-capacity date. This is more useful than simply entering an annual headcount number.
Attrition should be modeled as a planning assumption rather than treated as a certainty. A role may need a replacement, but a replacement may also be delayed, redesigned, automated, or consolidated with another role.
Digital systems also have lifecycle assumptions. A workflow may begin as a pilot, expand to one department, and later become enterprise-wide. The forecast should reflect these stages.
A good template can therefore contain separate columns for planned, approved, active, and productive capacity. This distinction makes the forecast much easier to explain during management reviews.

Step 5: Calculate workforce gaps
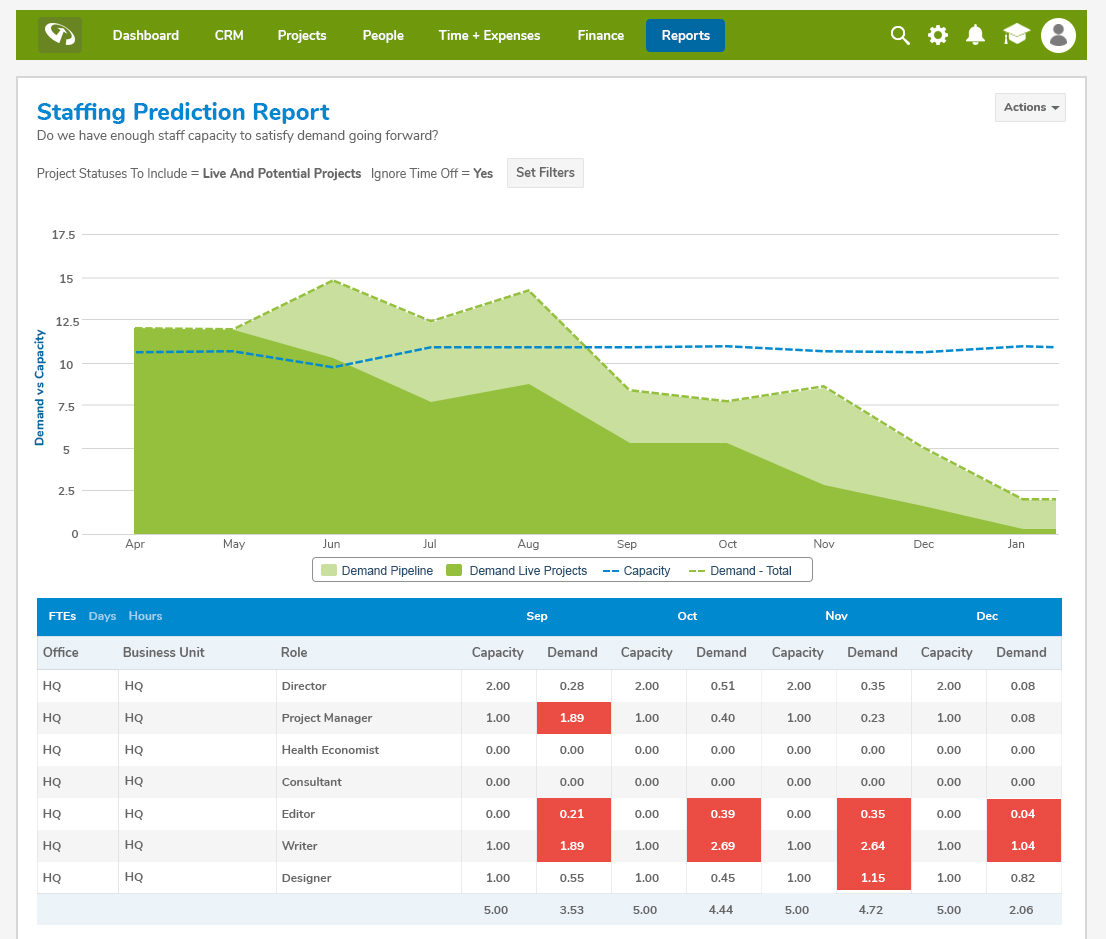
The gap is the difference between required capacity and available capacity. A positive gap indicates additional capacity may be needed, while a negative gap may indicate surplus capacity or an opportunity to redeploy resources.
Capacity gaps should be segmented by role and skill. An organization can have enough total employees while still having a shortage of software engineering, data analysis, compliance, customer-service, or management capabilities.
Digital gaps can also occur. A business may have several automation projects but still lack the integration, data, governance, or process-design capability required to make those projects operational.
Each gap should be connected to an action. Possible actions include hiring, training, redeployment, process redesign, outsourcing, automation, AI deployment, workload reduction, or postponement of lower-priority work.
This is where the template becomes a decision tool rather than a reporting document. The purpose of identifying a gap is to determine what should be done about it and by when.
Excel, Google Sheets, Word, PDF, and PowerPoint Formats
When to use Excel
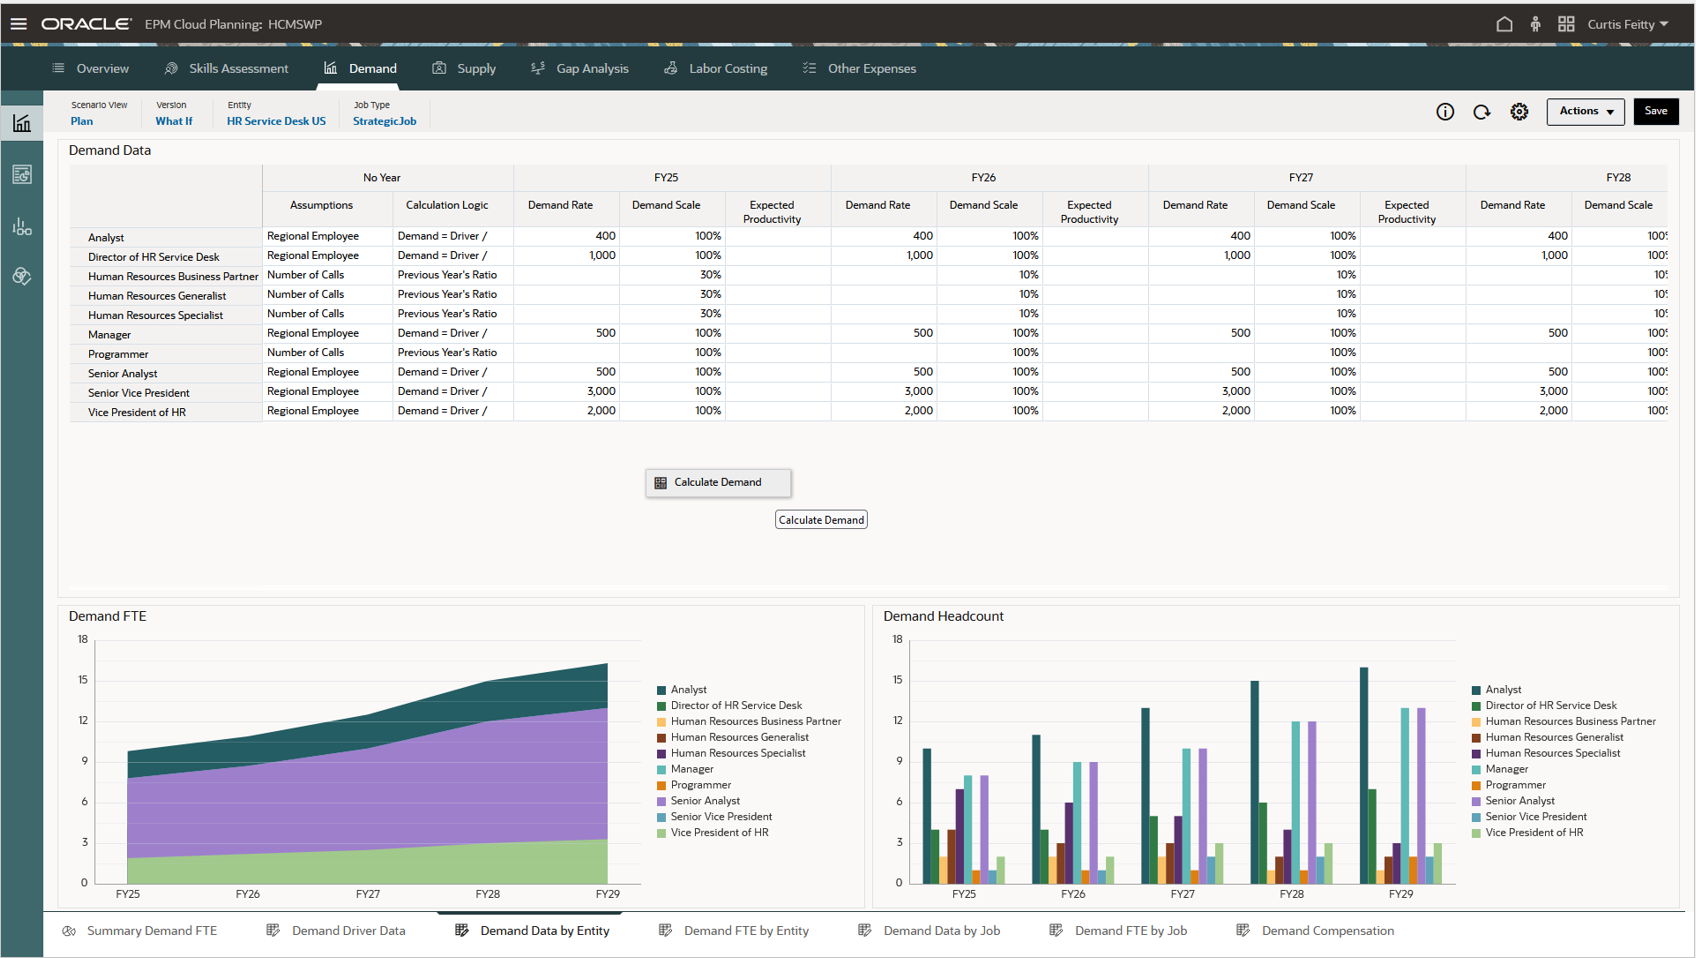
Excel is often the strongest choice when the forecast contains detailed calculations, multiple assumptions, monthly projections, scenario analysis, and financial modeling. It is particularly useful when finance teams need to connect workforce forecasts to compensation and operating budgets.
A practical workbook can use separate tabs for assumptions, employee baseline, digital workers, workload demand, capacity calculations, hiring plan, costs, scenarios, dashboard, and change log.
Formula-driven models should avoid unnecessary complexity. Use clearly named sections, consistent time periods, validation lists, and visible assumptions. A reviewer should be able to trace a headline number back to its source.
Excel is also useful for exporting data from HR or finance systems and performing what-if analysis. However, version control becomes important when several people edit separate copies.
For organizations that already rely heavily on spreadsheet-based budgeting, an Excel-based digital employees forecast template can provide a practical bridge toward more integrated workforce planning.
When to use Google Sheets
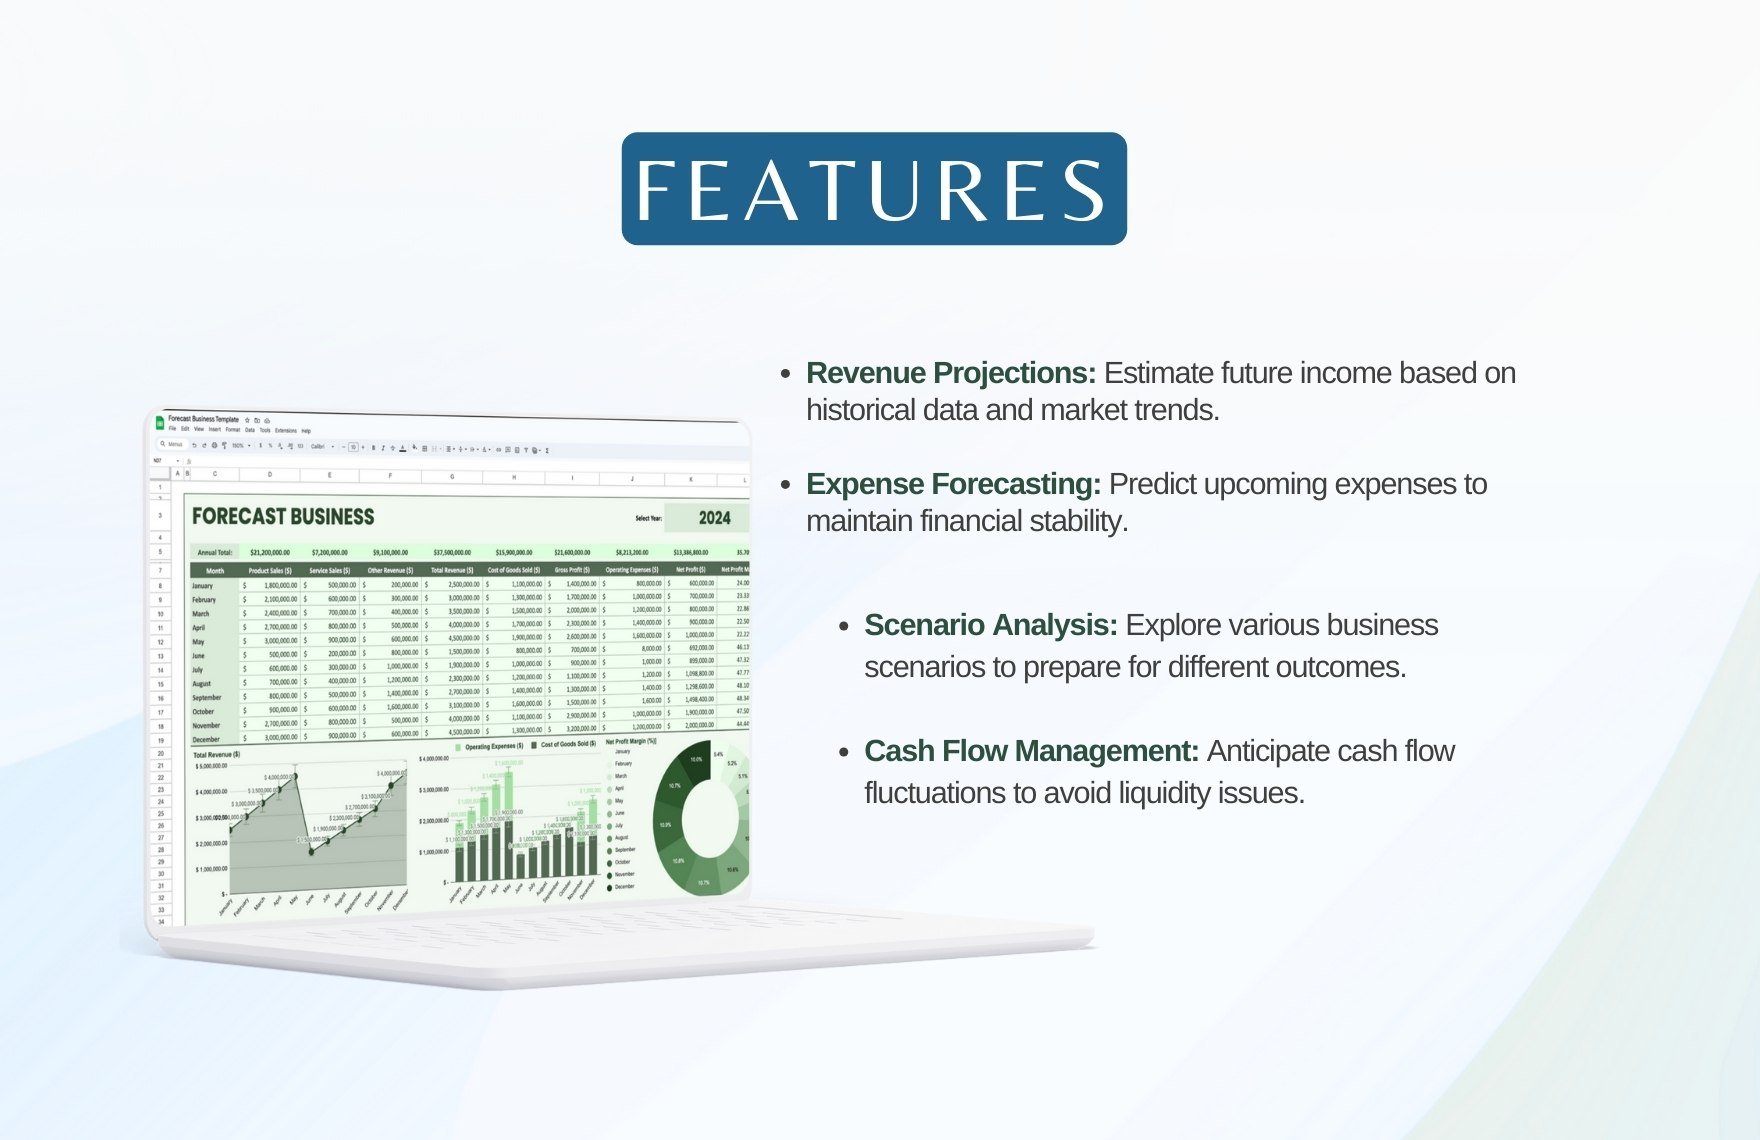
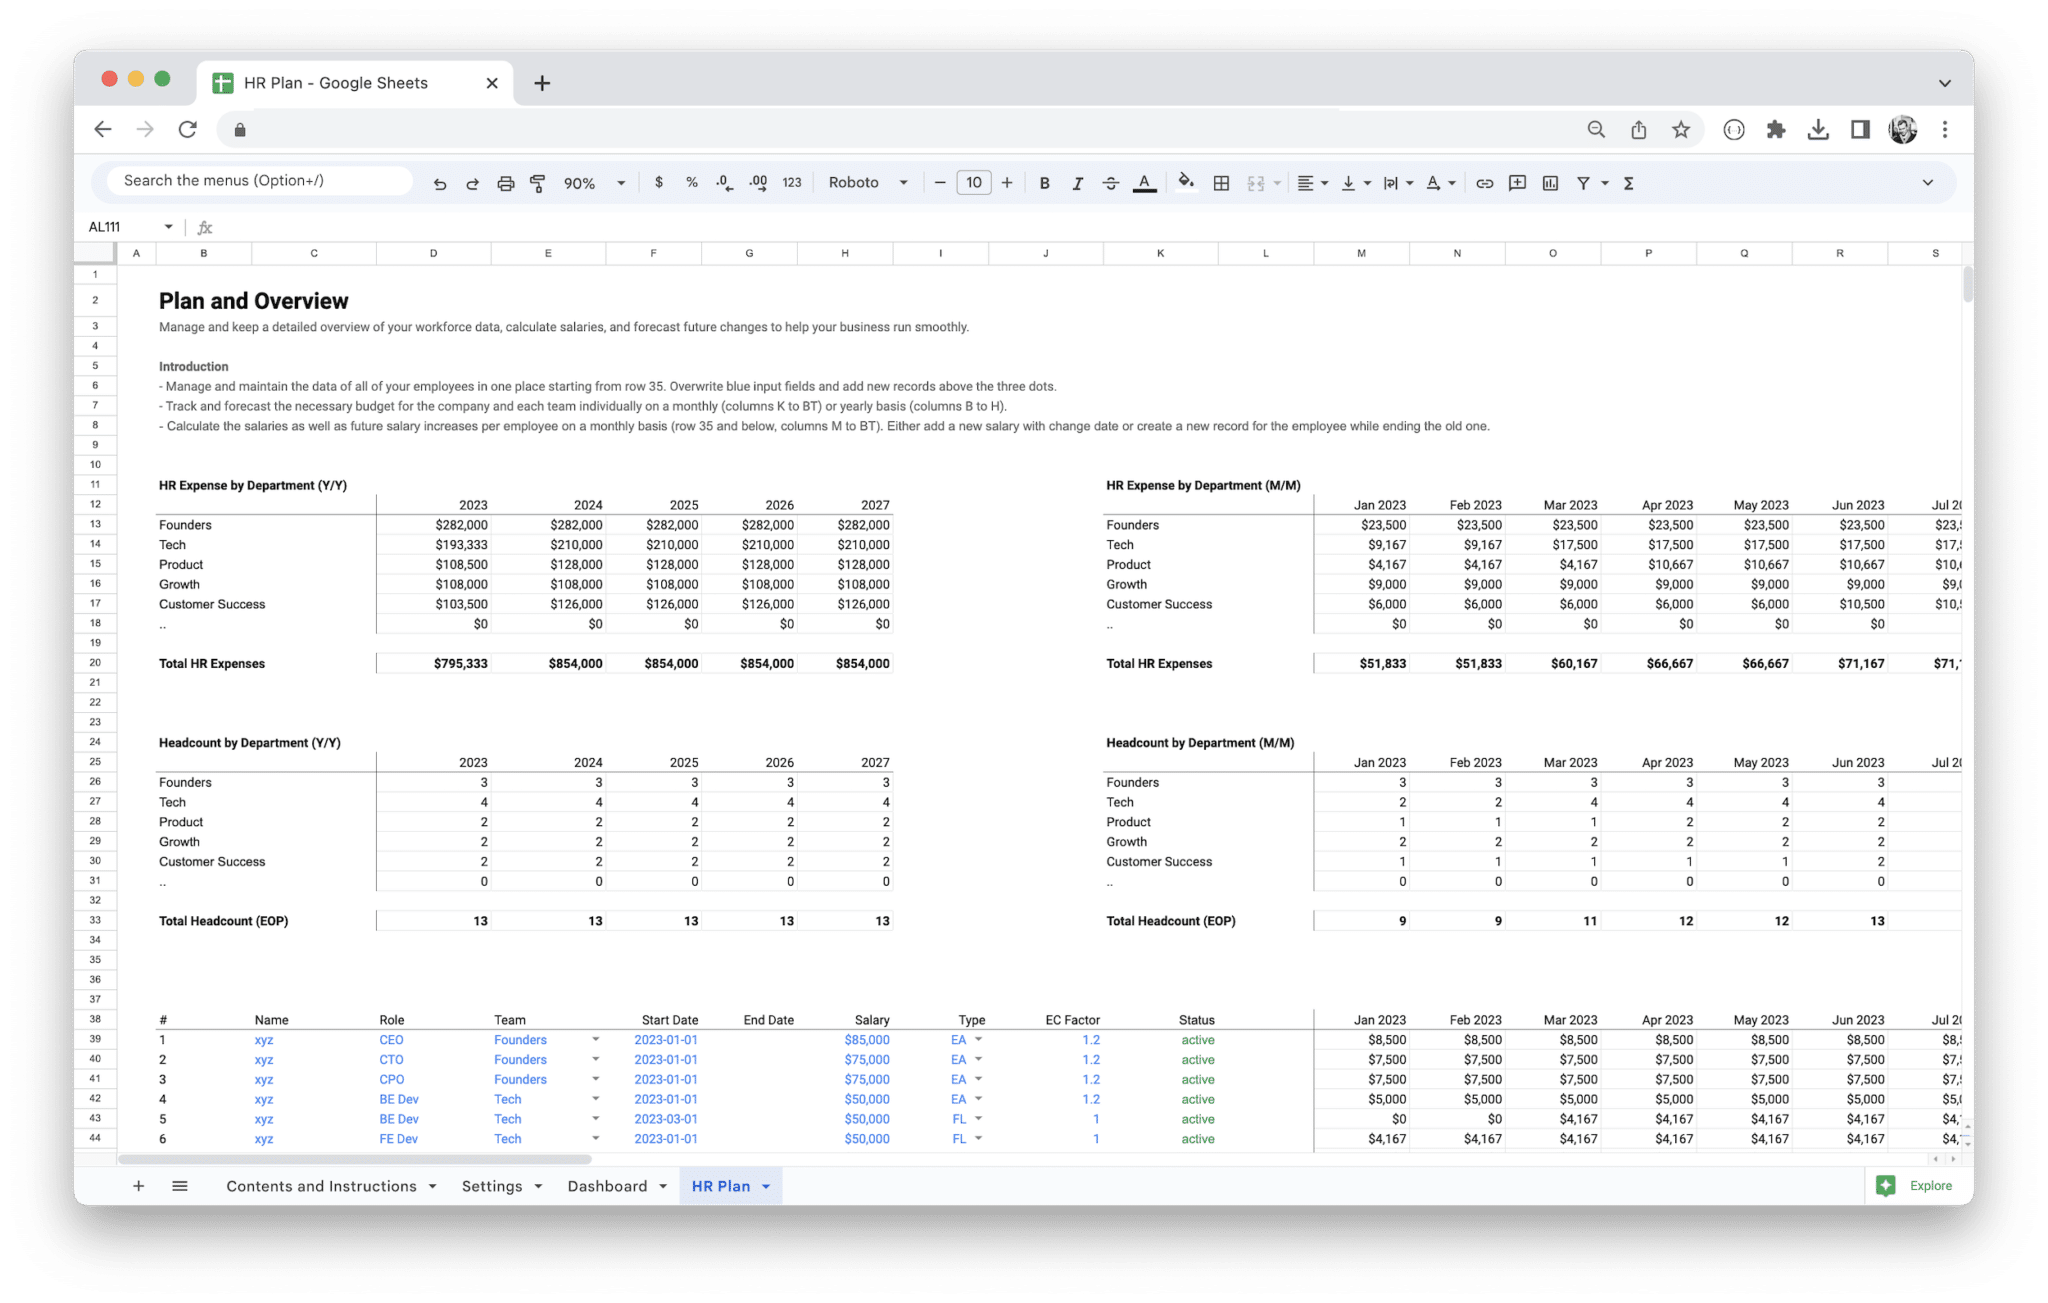
Google Sheets can be attractive when multiple stakeholders need to collaborate on the same forecast. HR, finance, operations, and department leaders can review assumptions without maintaining multiple emailed versions of the workbook.
It works particularly well for planning processes where the calculations are moderately complex and collaboration is more important than advanced desktop spreadsheet functionality.
Permissions should be designed carefully because workforce forecasts can contain salary, organizational, performance, and strategic information. Not every contributor needs access to every detail.
Use separate input and calculation areas where possible. This reduces the risk that someone accidentally overwrites formulas while entering forecast assumptions.
A Google Sheets model can also serve as a working layer before data is moved into a more formal planning or analytics platform.
When to use Word
Word is better suited to the narrative side of workforce planning. It can explain strategic priorities, capability gaps, organizational changes, workforce risks, implementation actions, and governance responsibilities.
A Word-based forecast should not attempt to replace a detailed calculation model. Instead, it can summarize the outputs of an Excel or planning system in a format suitable for executives, HR committees, project teams, or formal planning documents.
Useful sections include business context, current workforce profile, future workforce profile, gap analysis, workforce strategies, digital transformation implications, implementation roadmap, risks, and review process.
Tables can be used for concise summaries, but detailed calculations should remain in the underlying model. This keeps the narrative readable while preserving analytical depth elsewhere.
Smartsheet’s workforce resources illustrate this distinction by providing workforce planning materials in spreadsheet, Word, PDF, and other formats depending on the purpose of the planning activity.
When to use PDF
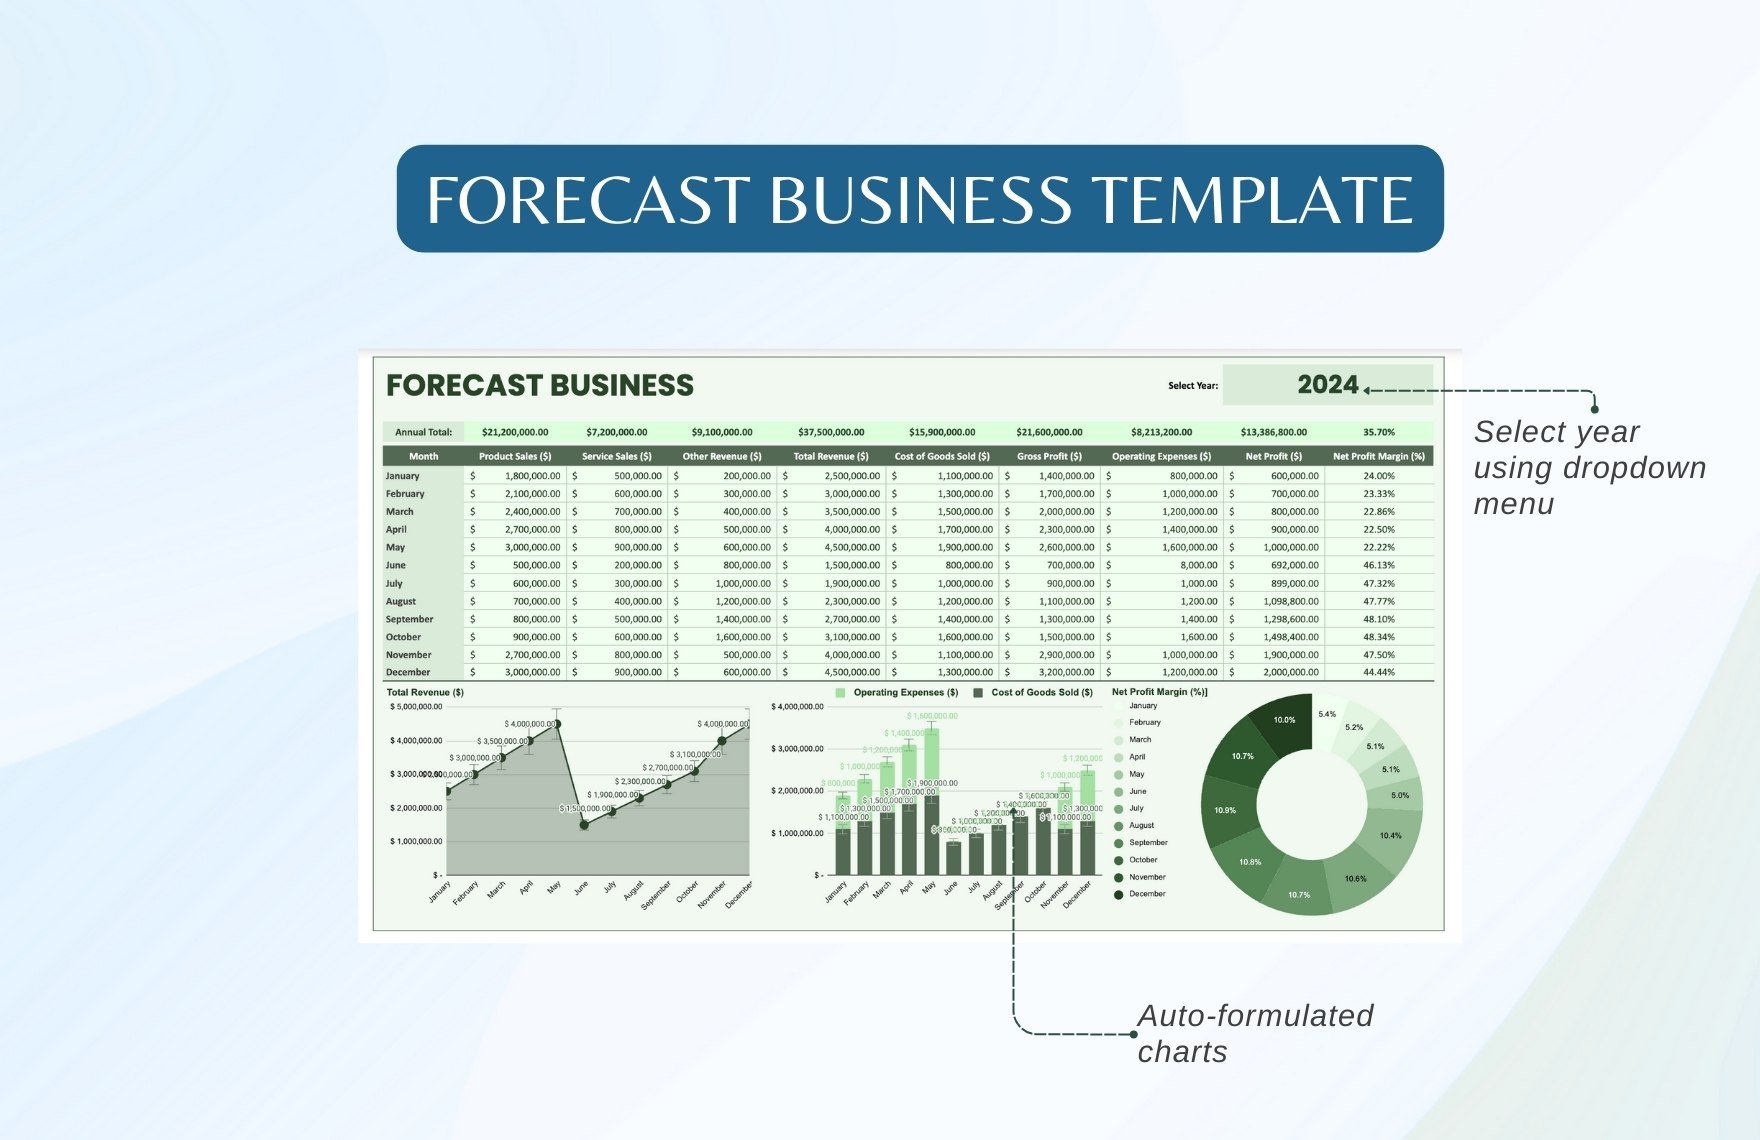
PDF is useful when the forecast needs to be distributed as a stable reference document. It preserves page layout and is convenient for board packs, planning reviews, formal submissions, and archived versions.
A PDF should normally be an output format rather than the primary modeling environment. Calculations are easier to maintain in Excel, Google Sheets, or a dedicated planning platform.
For a professional PDF, include a title, planning period, version date, assumptions summary, current-state baseline, future-state forecast, gap analysis, scenarios, recommendations, and ownership.
Do not describe a PDF as an editable template unless the actual resource supports editing. A static PDF and a fillable PDF serve different purposes.
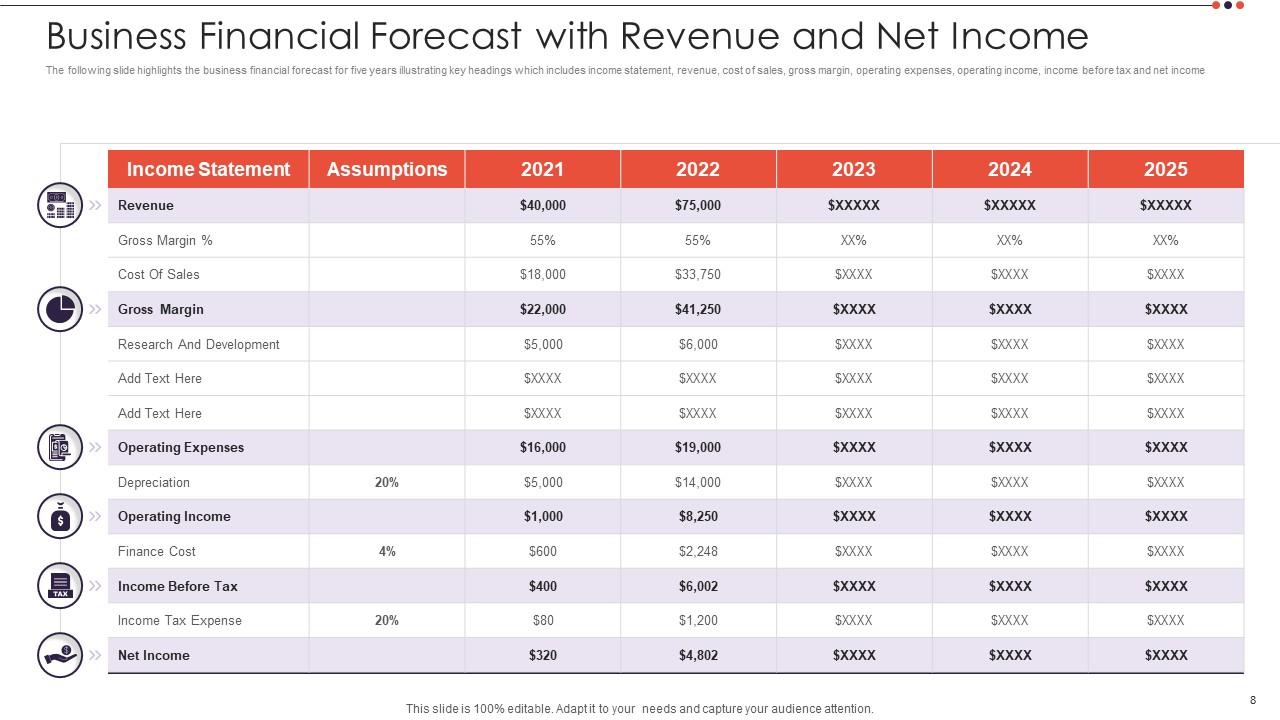
Smartsheet’s workforce forecasting material demonstrates a useful structure by covering business goals, current workforce characteristics, future workforce requirements, gap analysis, development actions, and review.
When to use PowerPoint
PowerPoint is best when the forecast must support a decision-making conversation. Executives rarely need every formula; they need to understand the current state, projected demand, major gaps, scenarios, cost implications, and recommended actions.
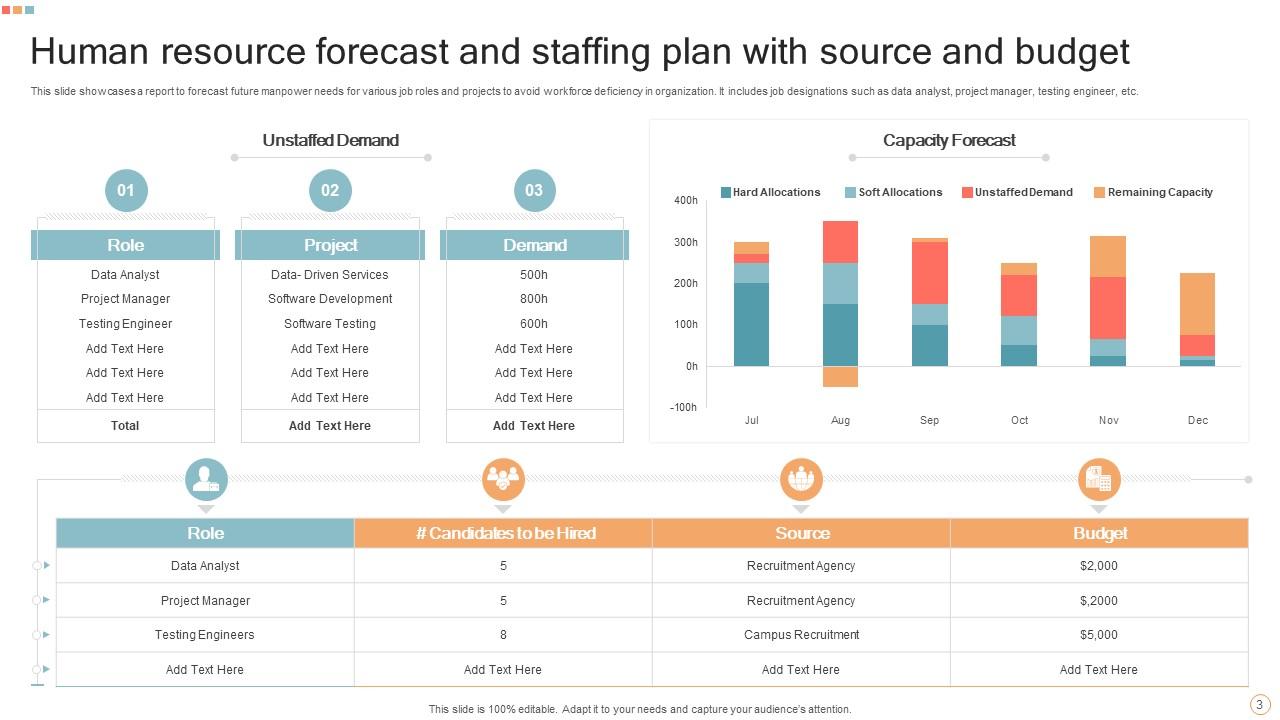
A concise presentation might contain an executive summary, current workforce mix, digital capacity overview, demand forecast, human-versus-digital capacity chart, hiring requirements, automation roadmap, scenario comparison, financial impact, risks, and decisions required.
Charts should be designed around decisions rather than decoration. A supply-versus-demand chart is usually more useful than a crowded dashboard containing dozens of unrelated metrics.
Use the same assumptions in the presentation and the underlying forecast model. A common failure occurs when a presentation is manually updated but the spreadsheet changes later.
PowerPoint is particularly useful for communicating the forecast to leaders who need to decide whether to approve hiring, automation investment, restructuring, or capability-development programs.
How to Forecast Digital Employees Without Treating AI as a Simple Headcount Replacement
The most important conceptual rule is that digital labor should not automatically be modeled as a one-for-one replacement for human employees. Work is composed of tasks, and different tasks have different levels of automation suitability.
Break a role into activities before deciding how technology affects it. A financial analyst, for example, may spend time collecting data, cleaning spreadsheets, producing recurring reports, investigating exceptions, discussing findings, and making recommendations. Automation may affect some activities strongly and others very little.
This task-level approach produces a more credible forecast. Instead of saying that an AI system replaces an analyst, the model can show that automation reduces routine preparation work while increasing the value of analytical judgment, stakeholder communication, validation, and exception management.
The same principle applies to customer support, marketing, software development, HR, procurement, legal operations, and administrative work. Digital employees can expand capacity without necessarily eliminating the underlying human function.
A mature forecast should therefore track task coverage, human oversight, quality, and remaining workload. That creates a workforce model based on actual work rather than speculative job-count assumptions.

Practical Forecasting Formulas
A basic human-capacity calculation can be represented as available working hours multiplied by the proportion of time available for forecasted work. If an employee has 160 nominal hours and 75 percent of those hours are available for the relevant workload, the planning capacity is 120 hours.
A simple workload requirement formula is forecast workload divided by productive output per FTE. If a hypothetical process requires 12,000 units and one productive FTE handles 1,500 units per month, the basic requirement is eight FTE.
Digital capacity can be represented similarly. If an automated process handles 6,000 units per month but has an expected effective utilization of 80 percent, a planning model may treat its effective capacity as 4,800 units rather than the theoretical 6,000.
The residual workload can then be calculated as total demand minus effective digital capacity. Human capacity requirements are calculated from the residual workload using the applicable productivity assumption.
These formulas are deliberately simple. Real models may need service-level constraints, queueing effects, task complexity, quality thresholds, seasonality, learning curves, exception handling, and multiple role types.

Scenario Planning for Digital Employees
Scenario planning is essential because the future adoption rate of digital employees is uncertain. Instead of producing one supposedly precise forecast, create several plausible scenarios based on different assumptions.
The base scenario can represent the currently expected deployment plan. A conservative scenario can assume slower adoption, higher exception rates, or delayed implementation. An accelerated scenario can assume faster deployment and stronger automation performance, provided those assumptions are realistic and testable.
Each scenario should show demand, human capacity, digital capacity, total effective capacity, workforce gaps, cost, and major operational risks. This allows decision-makers to see the consequences of changing assumptions.
For example, if automation deployment is delayed by three months, the model should show whether the organization needs temporary staffing, overtime, outsourcing, reduced service levels, or a revised project schedule.
Scenario planning also reduces emotional debates. Instead of arguing whether AI adoption will be “huge” or “small,” stakeholders can examine concrete cases and decide which assumptions they are willing to fund or monitor.
Connecting Workforce Forecasts to Business Forecasts
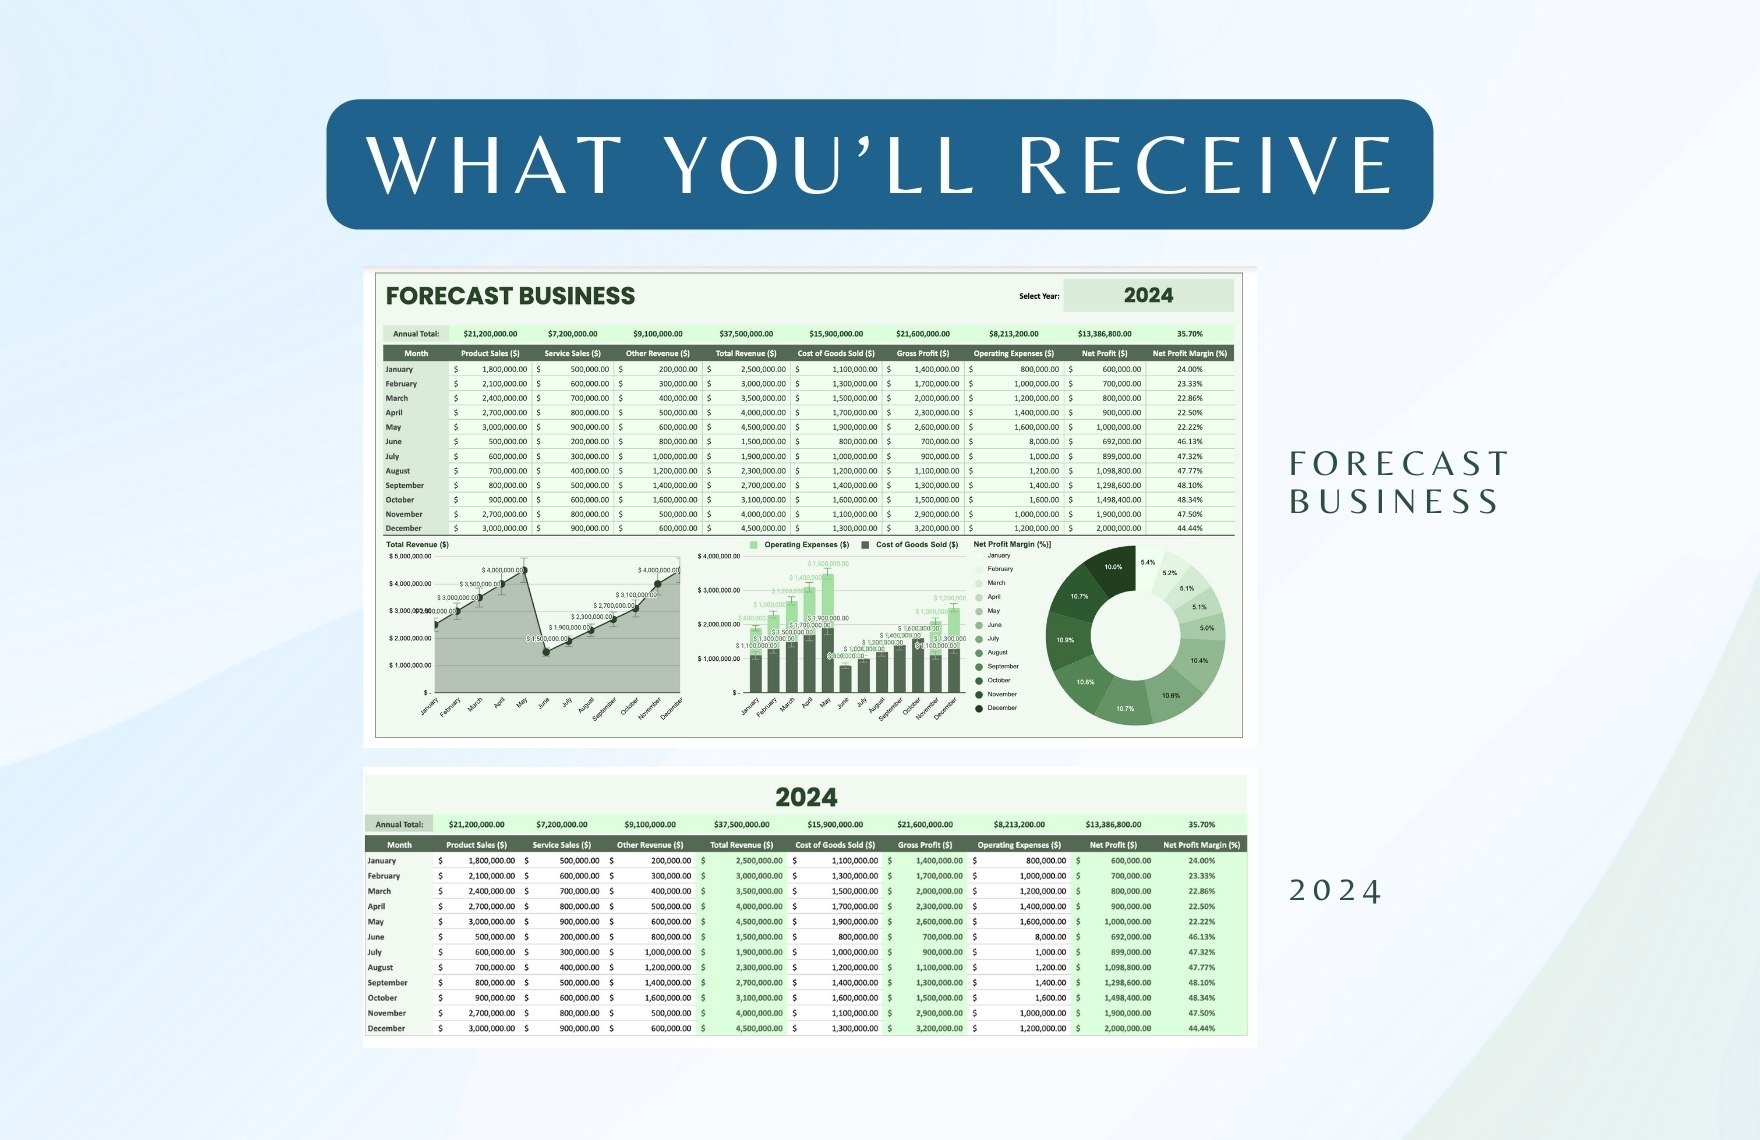
Workforce planning should not operate independently from the financial forecast. Labor and digital-worker costs should connect to revenue, workload, margin, operating expense, and strategic investment assumptions where appropriate.
If revenue growth creates additional service demand, the workforce model should show how that demand affects capacity. If automation reduces the labor required for a process, the financial model should show the corresponding technology and implementation costs rather than treating the labor reduction as pure savings.
This connection helps finance teams evaluate return on investment. A digital employee initiative should be assessed not only by headcount avoided but also by implementation costs, recurring technology costs, quality improvements, cycle-time reductions, revenue enablement, risk reduction, and employee capacity released for higher-value work.
Financial models should also distinguish between one-time and recurring costs. Implementation, integration, migration, and training may occur once, while licenses, usage, infrastructure, monitoring, and support may continue.
The result is a workforce forecast that can participate in normal business planning rather than remaining an isolated HR or technology exercise.
Data Collection and Governance
The quality of the forecast depends on the quality of the underlying data. Common sources include HRIS records, payroll systems, project management tools, ticketing systems, CRM data, finance systems, operational databases, and technology usage reports.
Establish one owner for each important input. HR might own employee records, finance might own compensation assumptions, operations might own workload forecasts, and technology teams might own automation capacity and implementation schedules.
Data definitions should also be standardized. “Headcount,” “FTE,” “productive hours,” “active digital worker,” and “automated task” should have clear meanings inside the planning model.
Access controls matter because workforce planning can expose confidential compensation or organizational information. Use role-based access where the platform supports it and avoid placing sensitive employee-level information into broad collaboration areas unnecessarily.
Finally, document the model. A forecast that only its creator understands becomes a risk. Include a short methodology section explaining data sources, formulas, assumptions, refresh dates, scenario definitions, and ownership.
Common Mistakes to Avoid
One common mistake is treating digital employees as a marketing concept instead of an operational capacity measure. A forecast should describe what a digital system actually does, not simply assign it an impressive employee-equivalent number.
Another mistake is ignoring human oversight. Automation may increase productivity while creating new review, quality-control, exception-handling, or governance work. Those activities need capacity too.
A third mistake is relying on a single growth assumption. Business demand is uncertain, so a base case alone can create false confidence. Scenario analysis is a better approach for strategic decisions.
Another problem is mixing actuals and forecasts without clearly labeling them. This makes it difficult for reviewers to understand whether a number represents observed performance or an assumption.
Finally, many models focus heavily on headcount and cost while ignoring skills. A workforce can have sufficient numerical capacity but still lack the capabilities required to execute the strategy.
Best Practices for a Professional Template
Keep assumptions separate from calculations. Users should know which cells or fields are intended for input and which are formula-driven.
Use consistent time periods. If the demand forecast is monthly, align workforce capacity, digital deployment, costs, and hiring timing to the same monthly structure wherever practical.
Use clear status categories such as planned, approved, in implementation, active, paused, and retired. These categories make it easier to distinguish future intentions from operational capacity.
Include a change log for major assumptions. When leadership asks why the forecast changed, the model should provide an answer rather than requiring someone to reconstruct the history manually.
Keep the executive dashboard simple. A useful dashboard can show demand, human capacity, digital capacity, total effective capacity, gap, labor cost, technology cost, and major risks without overwhelming the reader.

Practical Applications
In customer service, a digital employees forecast can estimate the number of human representatives needed after accounting for automated classification, self-service, AI-assisted responses, and human escalation.
In finance, the template can model transaction volume against automated reconciliation, reporting, data preparation, and human review capacity.
In HR, it can compare recruiting demand with recruiter capacity while identifying opportunities for automated scheduling, candidate communication, document preparation, and reporting.
In software development, the model can track engineering capacity alongside automated testing, code assistance, deployment automation, monitoring, and other productivity tools.
In professional services, the forecast can compare project pipeline demand with available employee capacity and automated administrative support, helping managers identify upcoming staffing constraints.

Practical Solution: Build a Working Digital Employees Forecast
Start with a single planning workbook or shared spreadsheet containing eight core areas: business drivers, current human workforce, current digital workforce, future demand, capacity calculations, hiring and deployment plan, cost model, and scenario dashboard.
First, establish the baseline. Import current headcount, FTE, role, department, skills, and relevant cost information. Add existing automation and AI systems with the tasks they perform and the effective capacity they currently provide.
Second, define demand. Identify the operational drivers that determine workload and create monthly or quarterly forecasts. Separate committed work from uncertain opportunities so the model does not treat every possibility as guaranteed demand.
Third, translate demand into capacity. Calculate human productive capacity and digital effective capacity independently. Subtract the available capacity from forecast demand to reveal gaps or surpluses.
Fourth, choose actions. For each gap, decide whether the best response is hiring, training, redeployment, automation, outsourcing, process redesign, or a change in demand priorities. Record the owner and target date.

Fifth, connect the plan to finance. Calculate salary, benefits, recruiting, technology, implementation, infrastructure, and support costs. Show one-time and recurring costs separately.
Sixth, create at least three scenarios. The base case should reflect the most likely assumptions. The conservative case should stress delayed adoption or weaker demand. The accelerated case should test stronger growth or faster technology deployment.
Seventh, establish governance. Assign owners for data, assumptions, workforce decisions, technology deployment, and forecast approval. Schedule regular reviews and define the circumstances that trigger an immediate reforecast.
Eighth, compare forecast against actual results. Track whether demand matched expectations, whether human productivity assumptions were reasonable, whether digital systems delivered their expected capacity, and whether new exceptions created additional work.
This process turns a static digital employees forecast template into a living workforce management system. The model becomes more accurate over time because actual operating results continuously improve future assumptions.
Reference Examples
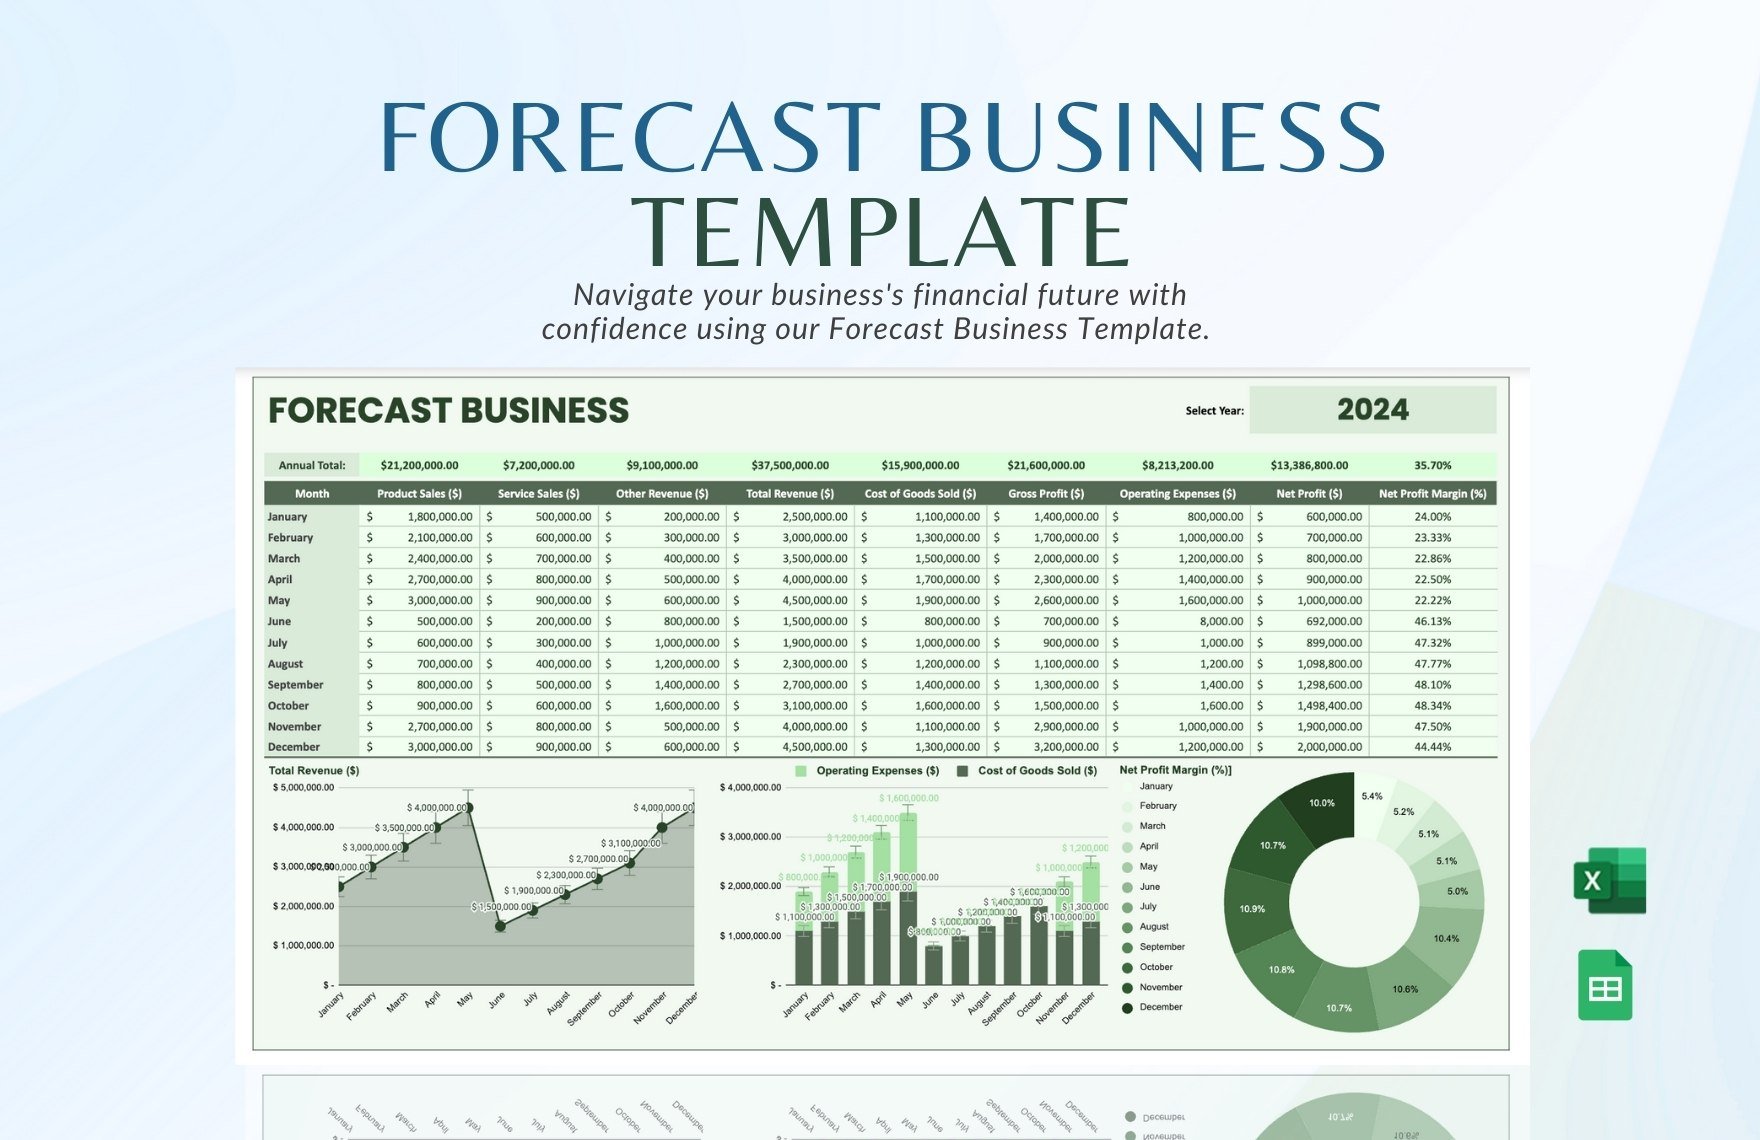
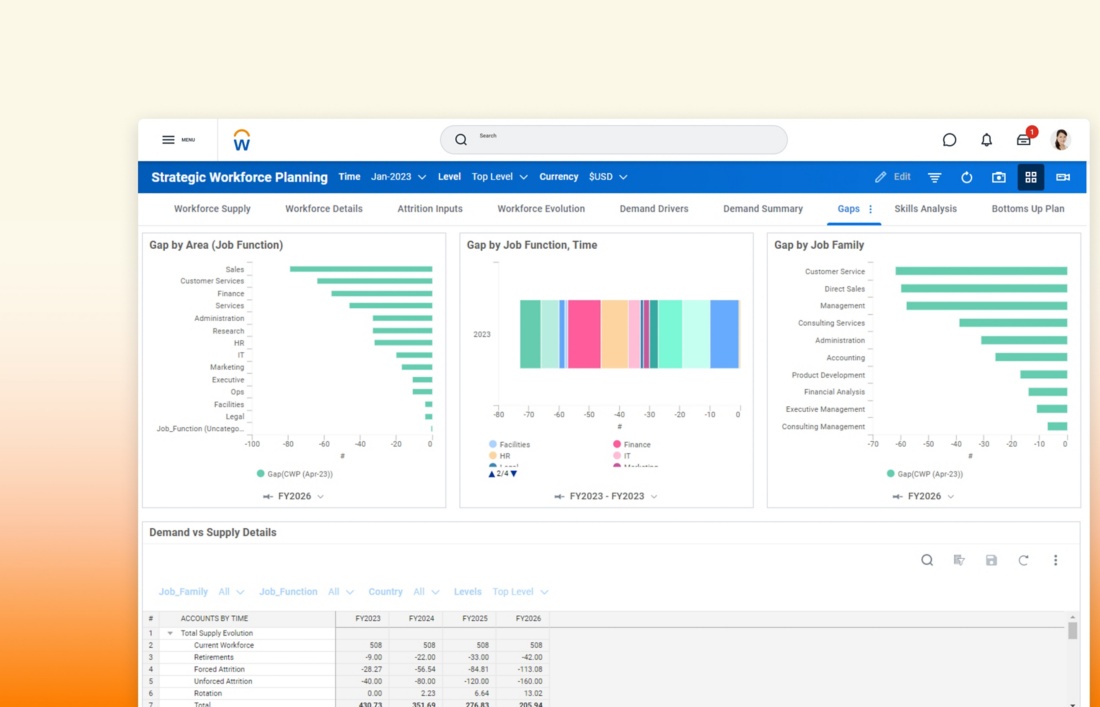
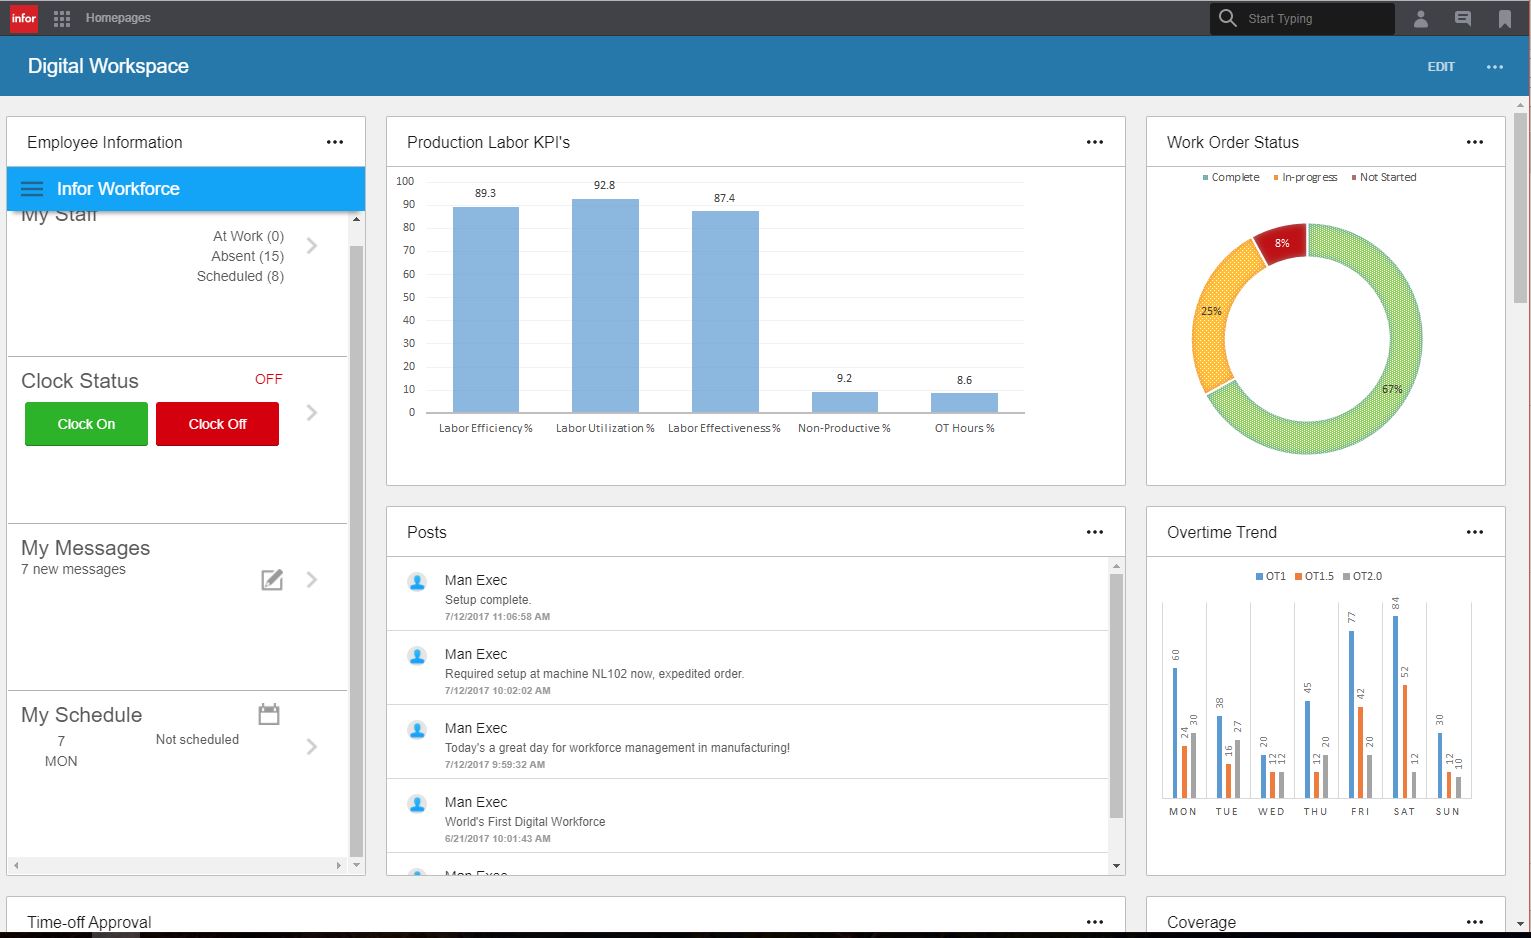
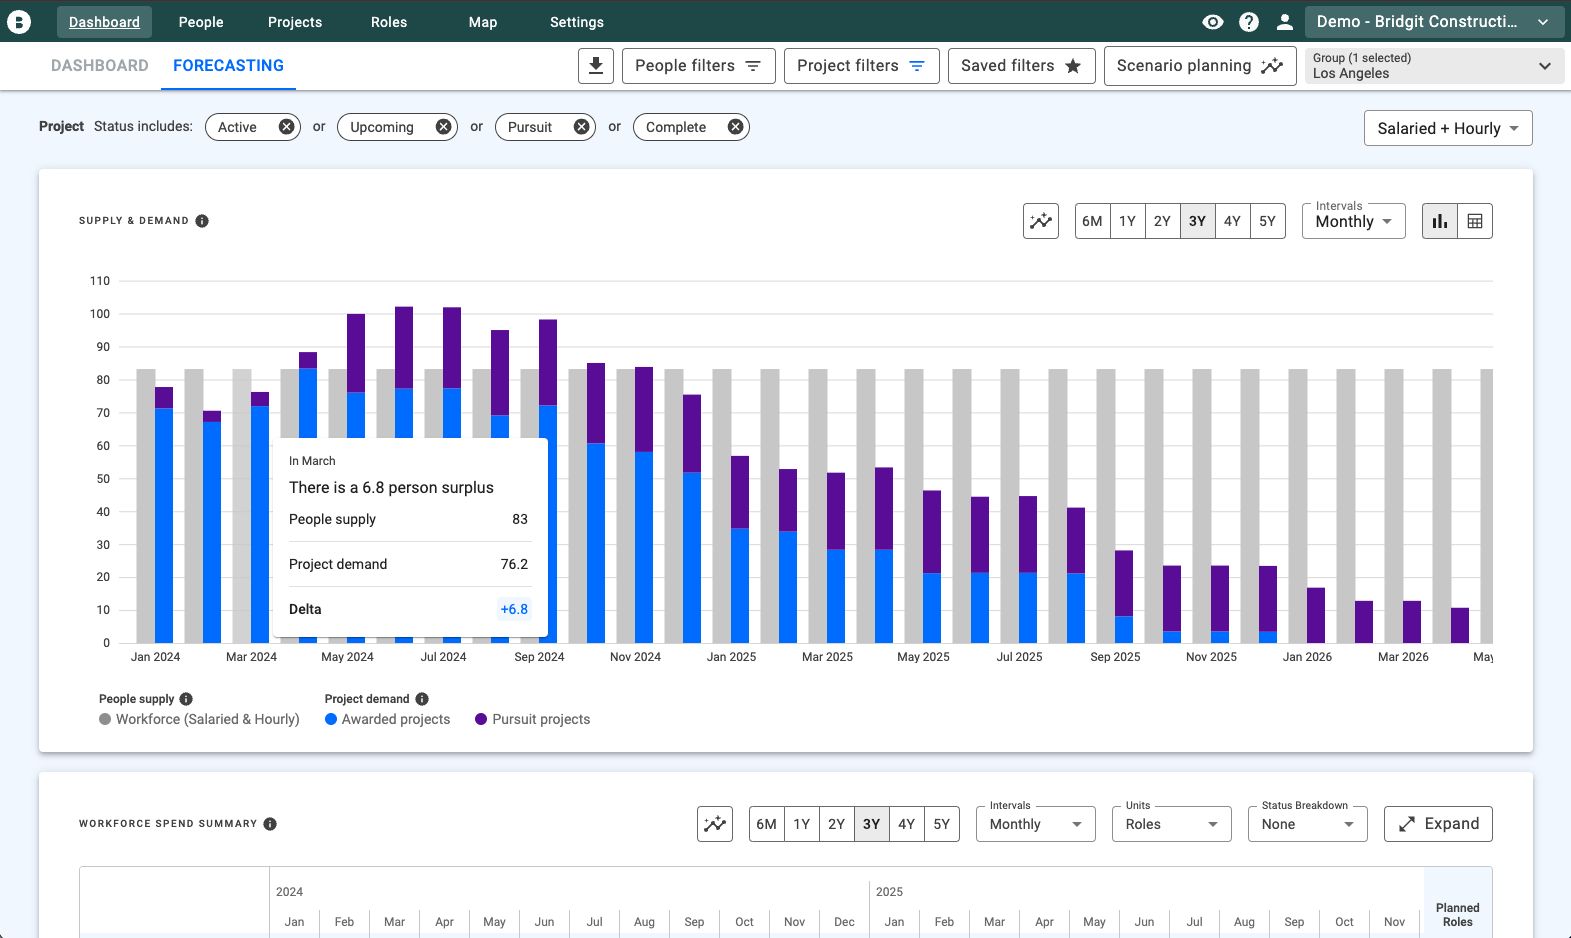
The following reference examples illustrate the types of visual structures that can support workforce, staffing, business forecasting, spreadsheet, presentation, and document planning. They are examples of formats and concepts rather than claims that every listed phrase corresponds to a single standardized industry document.
digital employees forecast template excel
Source: Template.net
digital employees forecast template google sheets
Source: GoLimelight
digital employees forecast template free
Source: 10XSheets
digital employees forecast template free download
Source: Template.net
digital employees forecast template powerpoint
Source: SlideTeam
digital employees forecast template excel free
Source: Corporate Finance Institute
digital employees forecast template pdf
Source: SlideTeam
digital employees forecast template word
Source: Template.net
email templates for business forecast
Source: Template.net
staffing forecast template excel
Source: Heimat Software
business forecasting template pdf

Source: Canva
business forecasting template download
Source: Template.net
Frequently Asked Questions
What should a digital employees forecast template include?
At minimum, include business drivers, current human capacity, current digital capacity, future workload, productivity assumptions, deployment timing, workforce gaps, costs, scenarios, and recommended actions. A more mature model can add skills, quality, exception rates, governance, and technology dependencies.
Can Excel be used for digital workforce forecasting?
Yes. Excel is well suited to detailed calculations, scenario analysis, workforce cost modeling, and monthly headcount planning. The most important consideration is not the software itself but whether assumptions, formulas, data sources, and ownership are clearly structured.
How is a digital employee different from a human employee in a forecast?
A human employee contributes capacity through working time, skills, judgment, and collaboration. A digital employee generally contributes automated processing capacity within a defined workflow. Digital capacity can often scale differently, but it still has limitations, costs, quality requirements, dependencies, and governance needs.
Should AI agents be counted as FTEs?
They can be represented using an FTE-equivalent measure for planning purposes, but the equivalence should be task-specific. It is better to calculate the amount of effective workload an AI system performs than to assign a universal employee-equivalent number.
Is a free template enough for professional workforce planning?
A free template can provide a useful starting structure. Professional planning depends more on the quality of the data, assumptions, governance, scenario design, and review process than on the price of the template.
Should the forecast include salaries and technology costs?
Yes, when the forecast is being used for budgeting or investment decisions. Human costs can include compensation and employment-related expenses, while digital costs may include software, usage, infrastructure, implementation, integration, monitoring, and support.
How often should a digital workforce forecast be updated?
The appropriate frequency depends on how quickly the business changes. Monthly reviews are practical for many organizations, while rapidly changing operations may need more frequent updates. A major contract, product launch, restructuring, automation deployment, or significant demand change should trigger a review regardless of the normal schedule.
Can the same template be used for small and large organizations?
The underlying logic can be shared, but the level of detail should change. A small business may need only a few departments and scenarios, while a larger organization may require role families, geographies, skills, cost centers, business units, security permissions, and integrated data sources.
What is the biggest forecasting mistake to avoid?
The biggest mistake is treating a forecast as a prediction that will automatically become true. A forecast is a structured set of assumptions. It should be tested against actual results, updated when evidence changes, and used to support decisions rather than create false certainty.
Conclusion
A well-designed digital employees forecast template gives organizations a practical way to connect business demand, human workforce capacity, AI and automation capacity, skills, costs, and strategic decisions. The strongest models do not assume that technology simply replaces people. Instead, they examine the work that must be completed, determine which activities can be automated responsibly, calculate the remaining human requirements, and show how different scenarios affect capacity and cost. Whether the working model is built in Excel or Google Sheets and communicated through Word, PDF, or PowerPoint, the essential principle remains the same: make assumptions visible, measure effective capacity, connect the forecast to business drivers, review the results against actual performance, and use the model as a living decision tool rather than a static spreadsheet.
